


 인쇄
인쇄


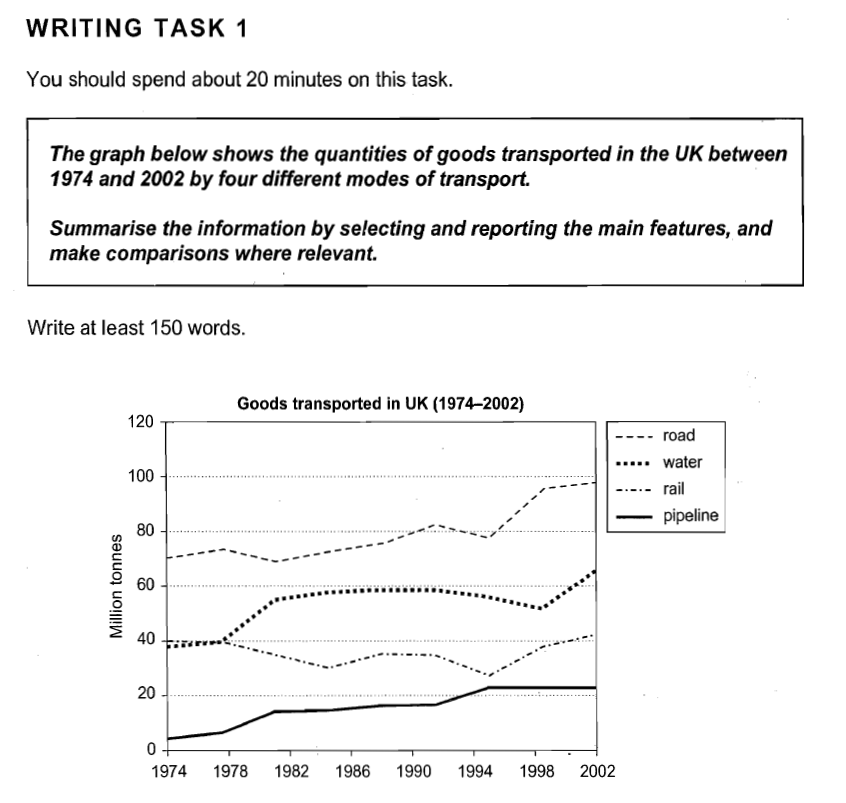
The line graph shows the amounts of different modes of goods transported which is road, water, rail and pipeline from 1974 to 2002.
It is obvious that the quantities of road were the most goods throughout the whole periods. Water and rail were similar from 1974 to 1978 but the difference had been larger from 1978. Pipeline had the upward trend slowly.
Even though road experienced dicrease in 1982 and 1994, it gradually increased and peak at under 100 million tones in 2002. In 1974 and 1978, water and rail were 40 million tones similarly but, while water went up, rail went down from 1982. The gab was the most in 1986 and 1994. In spite of the upward trend, pipeline remained as under 20 million tones from 1974 to 1994. Since then, it was above 20 million tones until 2002.

 댓글 0개
댓글 0개


 불편사항 신고