


 인쇄
인쇄


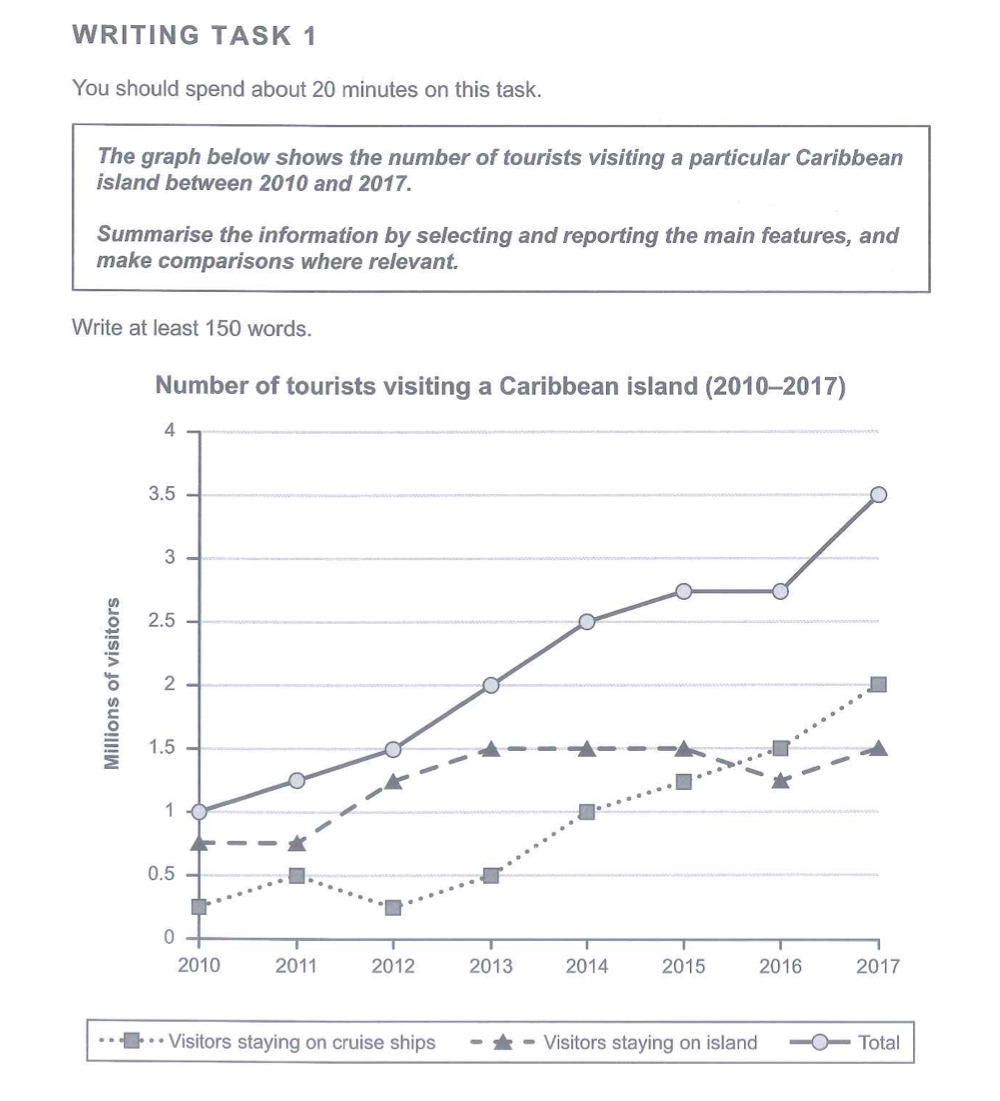
The line graph gives information on each figure of people who traveled in a particular the Caribbean island in two different ways, which are cruise tours and trips on the island, and the total amount of tourists from 2010 to 2017.
It is clear that the number of both types of tours increased over the period shown. Even though both graphs representing each amount tend to fluctuate, the total number went up over threefold.
In 2010, the figure for tourists who stayed on the island was higher than the figure for tourists who stayed on the cruise three times. However, since 2012, the number of visitors staying on cruises had risen rapidly. While just 1.5 million people visited the island, 2 million people spent time on the cruise. (이거 관련해서 구체적인 시점을 적어주셔야 합니다.)
We can also see that the number of people staying on the island was maintained between 2013 to 2015. (<-----이 문장의 경우는 구체적인 수치를 적어주셔야 하고요.) By contrast, the rate number of cruise users rose by under 1 million people. As a result, the total number climbed as same as an increase in cruise users.
시간은 재지 못했구요ㅠ 목표 점수는 6.5-7.0 입니다!
총평: (5/6/7/6) 6.0
일단 지금은 6.0이긴 한데, 이는 단순히 요령 부족으로 인한 것이며, 어휘+문법에서는 그렇게 문제가 크지 않다는 점을 고려했을 때 요령만 잘 챙기면 6.5까지는 충분히 괜찮을 겁니다.
지금 마지막 두 문단, 즉 세부적인 분석을 해야하는 문단에서 구체적인 시점이나 수치의 누락이 많이 보입니다. 이를 꼭 추가해주세요! 또한, 꺾은선그래프에서는 수치 간 역전을 다루는 것이 중요합니다. 이러한 부분도 넣어주세요~
수고하셨습니다 :)

 비밀번호 확인
 댓글 0개
댓글 0개


 불편사항 신고