


 인쇄
인쇄


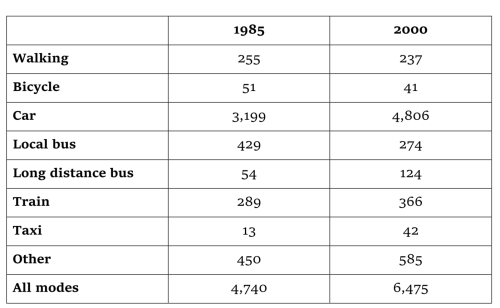
The table below gives information about changes in modes of travel in England between 1985 and 2000.
Average distance in miles traveled per person per year, by mode of travel
1. 라이팅에서의 목표점수: 6.5
2. 다음시험 날짜 그리고 위의 점수를 아무리 늦어도 언제까지는 만들어야 하는지: 최소 2021년 8월
3. 현재 글을 쓰는데에 몇분이 걸렸는지 + 단어수 + 외부도움: 19~20분 +198단어 + 외부도움X
4. 그 외 제가 알아두면 도움될만한 기타 정보나 현재 학생 여러분들의 공부상황: 영국대학 오퍼를 받았고 아이엘츠 제출을 위해 군대에서 독학중입니다 감사합니다
+++++ 10월 24일 쯤 첫 아이엘츠 응시 6.0 이상 기대
My answer
The table below illustrates how people's modes of travel in England had been changed between 1985 and 2000. In general, people in England traveled more in 2000 compared to 1985. Moreover, car is the most popular vehicle in both years respectively 1985 and 2000.
In 1985, people in England traveled for 3,199 miles on average by taking a car. This figure was the largest modes of travel in 1985. On the other hand, average distance in miles traveling for a taxi was the shortest in 1985. People in England only take a taxi for 13 miles while traveling. In 2000, people in England traveled for 4806 miles on average while riding a car, and this figure is the highest. However, the smallest using modes of travel in 2000 is a bicycle which the average distance in miles traveled is only 41 miles.
In fact, the highest increased modes of traveled between 1985 and 2000 was a car. The average distance in miles traveled by using car increased 1,607 miles for 15 years. Also, the highest decreased modes of traveled for 15 years was a local bus. The amount of decreased for using a local bus was 155 miles.

 댓글 0개
댓글 0개


 불편사항 신고