


 인쇄
인쇄


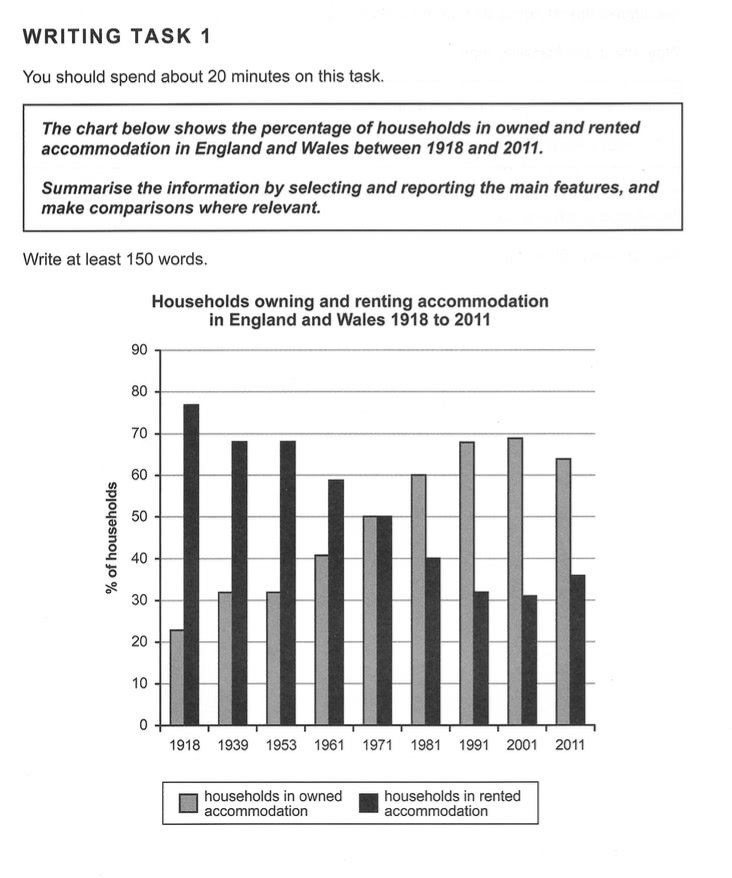
The bar chart illustrates the percentage of house ownerships and rented habitations in England and Wales between 1918 and 2011.
It is clear that the number of families in owned accommodation increased steadily almost decade by decade. However, the percentage of households in rented accommodation went down gradually noticeably.
Regarding the year 1918, obviously rented residents occupied the highest percentage compared to the lowest number of owned accommodation. After almost two decade, in 1939, the rate of ranted accommodation took 68 per cent and it remained the same amount until 1953. However, it continued to decrease by approximately 10 per cent until 1991 and consistently declined by 1 per cent in 2001. In 1971, both types of accommodation shows the exact same percentage, 50 per cent. By contrast, the owned house indicated the uptrend until 2001 but the feature slightly dropped by 63 per cent after 10 years, in 2011, while the households in rented accommodation number were relatively lower.

 댓글 0개
댓글 0개


 불편사항 신고