


 인쇄
인쇄


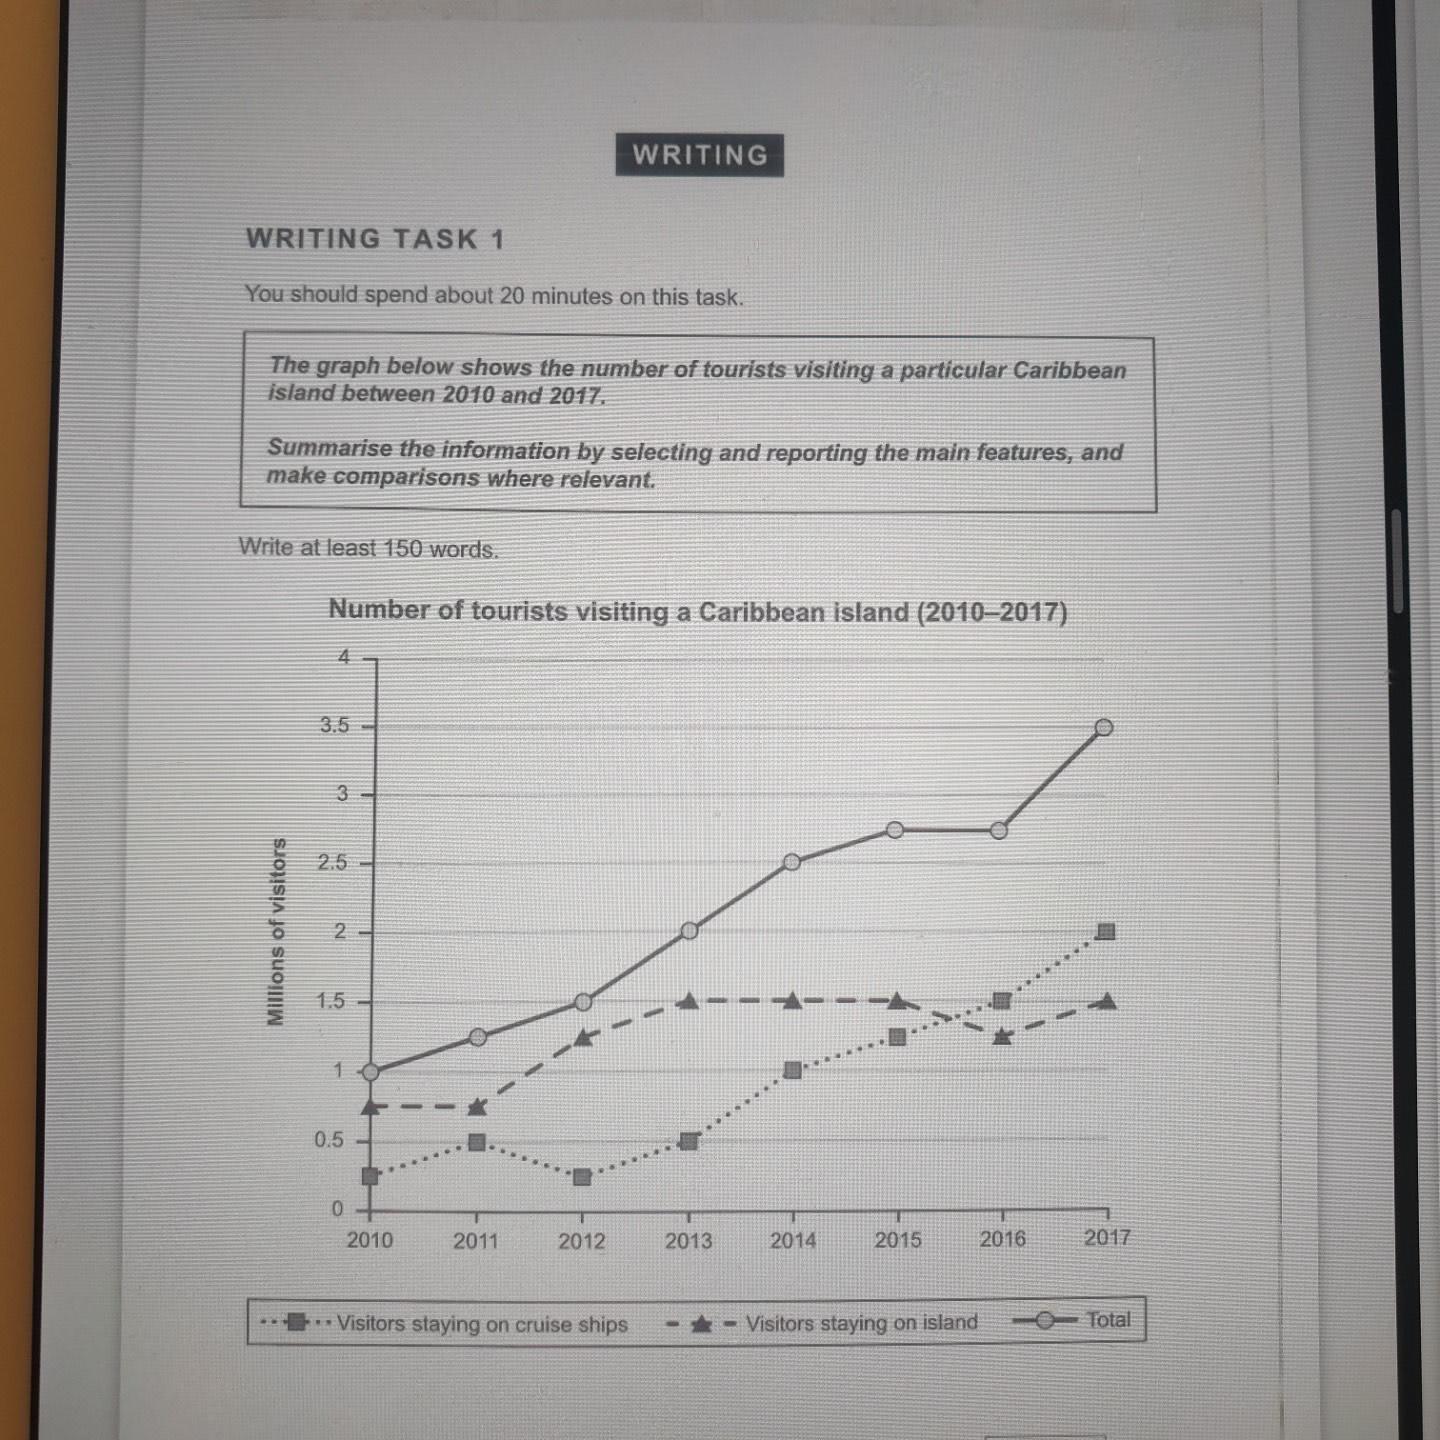
The given line graph illustrates how many tourists visited to a Caribbean island from 2010 to 2017.
As an overall trend, it is evident that the total number of the tourists showed an upward trend during the given period year. While people who stayed on cruise ships was higher than those who stayed on the island until 2015, the total number of those who stayed on the ships was much (낮긴 하지만, much lower라고 보기에는 어렵습니다.) lower than the other for the year 2017.
(여기 이하의 내용을 언급하기 이전에, 먼저 total visitors 에 관한 세부 분석도 짧게나마 해주셔야 합니다.)A more detailed look at the line graph reveals that from 2010 to 2015, although the number of visitors who opted to stay on the island remained stable from the year 2013 to 2015, the number of them was bigger than that the other. Moreover, whereas there was a bit of decrease of 0.25 million between 2011 and 2012 in visitors who stayed on the ships, it constantly increased after since 2012.
It is noticeable that visitors staying on the island exceeded those staying on the ships in number between 2015 and 2016. Since then, the number of tourists on the ships climbed at 2 million in 2017, and that of visitors on the island also went up by 0.5 million.
목표점수 7.0 걸린시간 20분
감사합니다!
총평: (6/7/7/7) 7.0
이번 글은 7.0을 드리긴 했지만, 표현적으로 조금 아슬아슬한 상황입니다. 아마 6.5를 주는 채점관도 충분히 있을 거에요. 고로 여기서 만족해서는 안 되고, 제가 꾸준히 강조드리듯이 문법+어휘+모범답안 분석은 꼭 해주세요!
수고하셨습니다 :)

 비밀번호 확인
 댓글 0개
댓글 0개


 불편사항 신고