


 인쇄
인쇄


Q. The chart below shows the amount of water used per month by and average household in Japan, Portugal, Canada, and China between 1990 and 2010. Summarize the information by selecting and reporting the main features, and make comparisons where relevant.
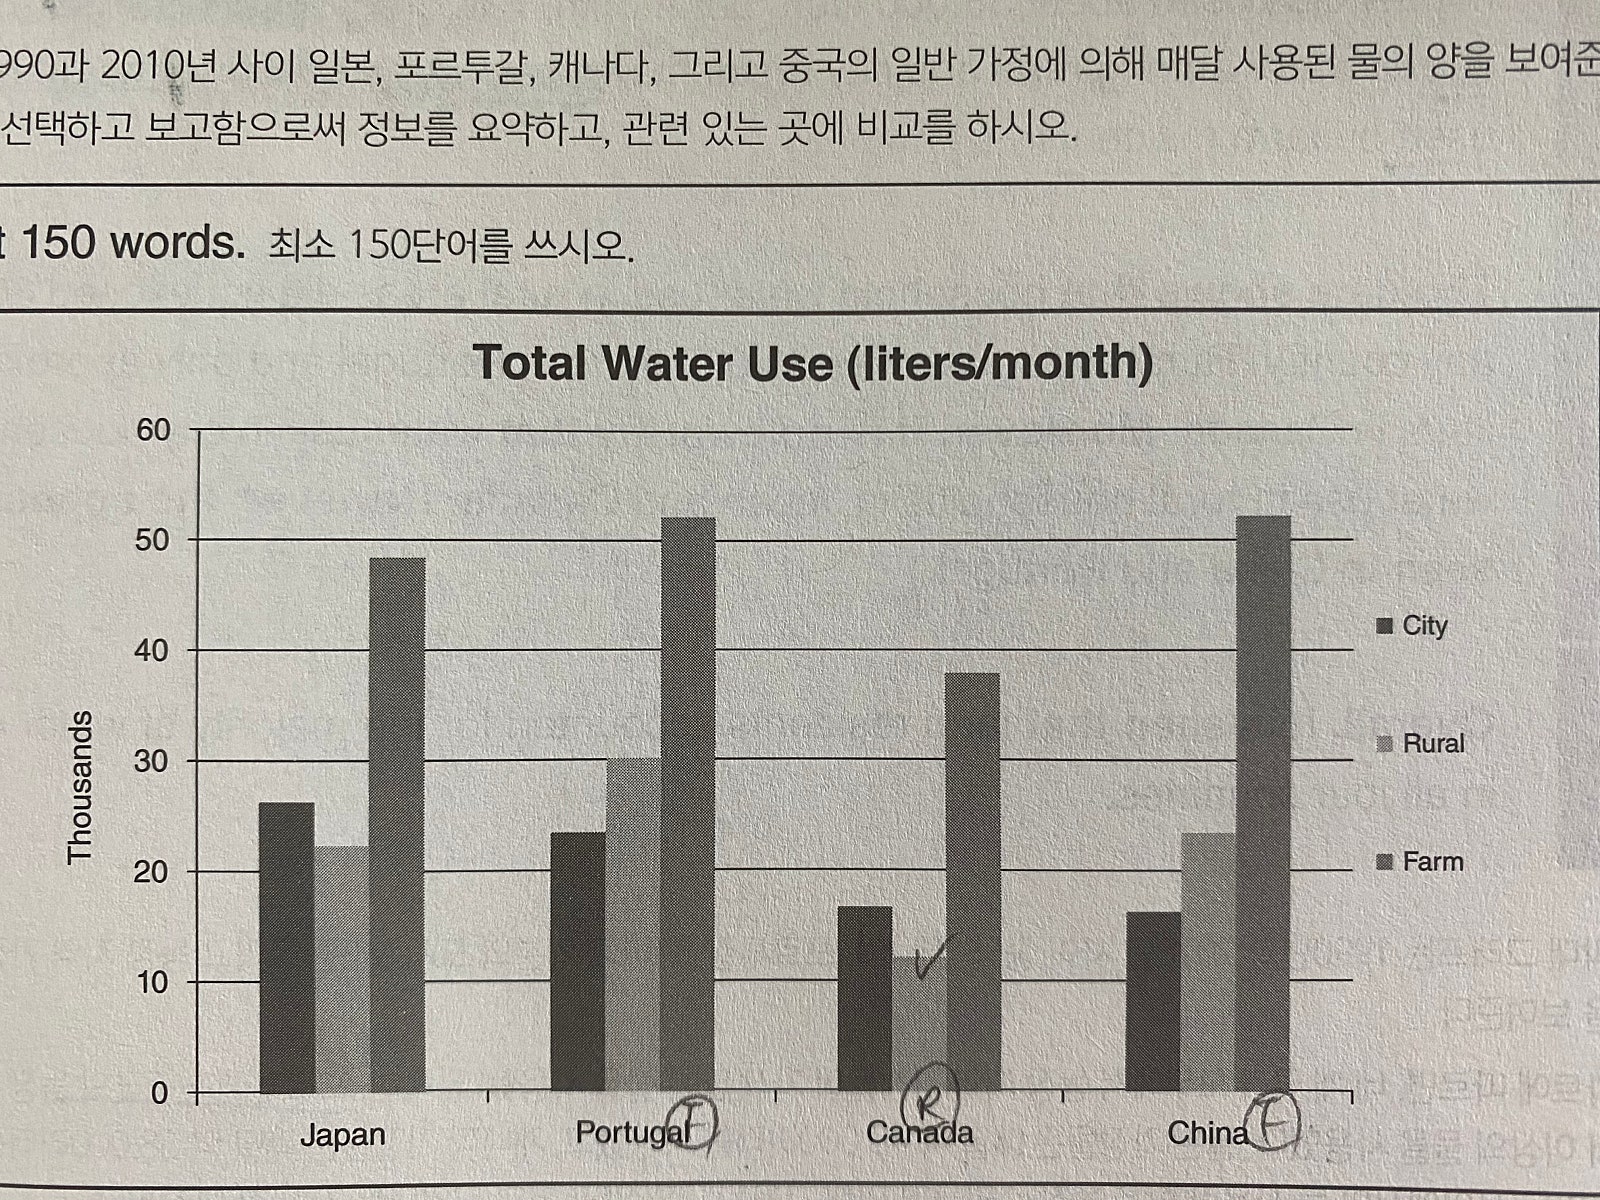
Overall, farm residents’ water use accounted for the major amount among all the countries. Farm residents in Portugal and China made up the largest amount of water use. In contrast, farms in Canada made up the smallest water consumption.
The data shows that water uses of farm residents in Portugal and China were over than 50,000 liters. This figure was followed by farms in Japan which used water less than 50,000 liters and farm residents in Canada used approximately 37,000 liters, respectively. Interestingly, Canada accounted for the least water use among the whole countries mentioned above, except for city dwellers used slightly more water than Chinese city dwellers.
The noteworthy thing is that Japan and Canada’s city residents utilized more water than rural area residents. However, the opposite trends were seen by Portuguese and Chinese. In addition, whole countries’ city and rural areas water use did not overtake 30,000 liters in each.
176자 / /시간 40분 -> 실수들 한번 수정했어요. / 시험일 : 10월 말. 목표점수 6.5 // 참고정도: 모범답안 3번 베껴썼었어요.
감사합니다.

 댓글 0개
댓글 0개


 불편사항 신고