


 인쇄
인쇄


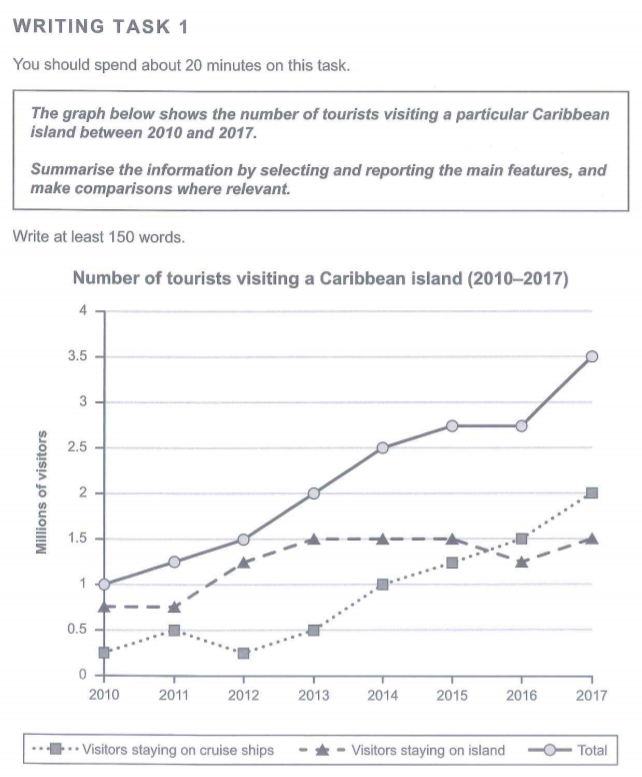
The given line graph illustrates that how many tourists visited a particular Caribbean island from the year 2010 to 2017 and the ways how they stay on the island in two groups.
Overall, it is noticeable that the population to visit a Caribbean island surged during 7-year period. Moreover people who visited the island preferred staying on island to staying on cruise ships in 2010, in which the first was doubled the latter, and the trend was converted in 2016.
Looking at the graph more closely, one can see that the total number of the tourist roughly tripled from 1 million to 3.5 millions and more tourists visited the island every each year than previous year except in 2016, which was same as much as in 2015. Furthermore, the upward trend is clear in the figures of the visitors staying on cruise ships. After the year 2012 in which the number of tourists preferring cruise ships halved from 0.5 millions to about 0.25 millions, however, tourists tended to stay on cruise ships more and became a high of 2 millions tourists in 2017. On contrary, visitors who enjoying being in island doubled to 1.5 millions in 2013 and constantly maintained stable until 2017.
-----------------------------------------------------------------------
task2 동의 / 비동의에서 방황하다,,,, 좀 익숙해지니,, task 1이 또 힘들게 하네요.ㅠㅠ
task 1 20분 안에 써 내는게 시간이 부족하네요. 특히 다양한 문장 쓰는게 쉽지가 않네요.
첨삭부탁드립니다. 8월에 시험 접수했는데..ㅠㅠ

 댓글 0개
댓글 0개


 불편사항 신고