


 인쇄
인쇄


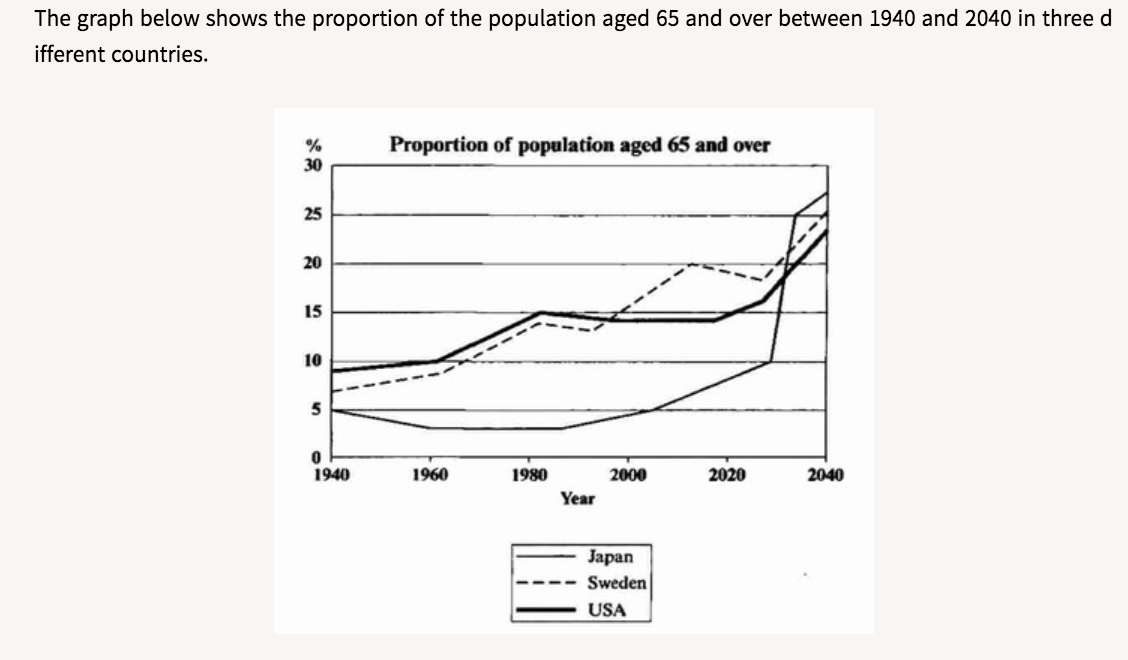
The given line chart indicates the statistical information of the portion of the elder people whose who were (cacaonibs님 실력이면 이런 거 틀려서는 안 됩니다.) over 65 in Japan, Sweden, and the USA.
Overall, it is clear that the proportion of Sweden and the USA countries have show show (이렇게 가면 과거 미래 현재를 한꺼번에 다 포괄할 수 있습니다.) an upward trend in a given period. Meanwhile, that of Japan remained the same and then soared exponentially after 2020.
Looking at the graph more closely, one can see that the USA and Sweden were experiencing a similar growth pattern from 1940 to 1980. From 1990, while the portion of American people over 65 stayed at 15% till until 2020, that of Sweden jumps up to almost 20%, by surpassing the aging population in the USA. Japan had the lowest rate in old people during more than 80-year period. It is noteworthy that the rate of Japan did not reach 5% until 2000, however, the proportion of the population aged over 65 is predicted to surge considerably in future. The countries country which have the highest rate of elderly people will be Japan, followed by Sweden and the USA in sequence. In general, every country will have an increase in aging population of the overall population.
wc :189
goal; 7.0
감사합니다.
총평: (7/6/7/6) 6.5
평소 써주시는 거에 비해 조금 아쉬웠네요. 다른 건 그렇다고 치더라도 서론에서의 문제는 cacaonibs님 실력을 고려했을 때 생기면 안 되니까 더 주의를 기울여주세요!
수고하셨습니다 :)

 비밀번호 확인
 댓글 0개
댓글 0개


 불편사항 신고