


 인쇄
인쇄


The graph below shows the employment rate of each gender in four different countries in 2002.
Summarise the information by selecting and reporting the main features, and make comparisons where relevant. Write at least 150 words.
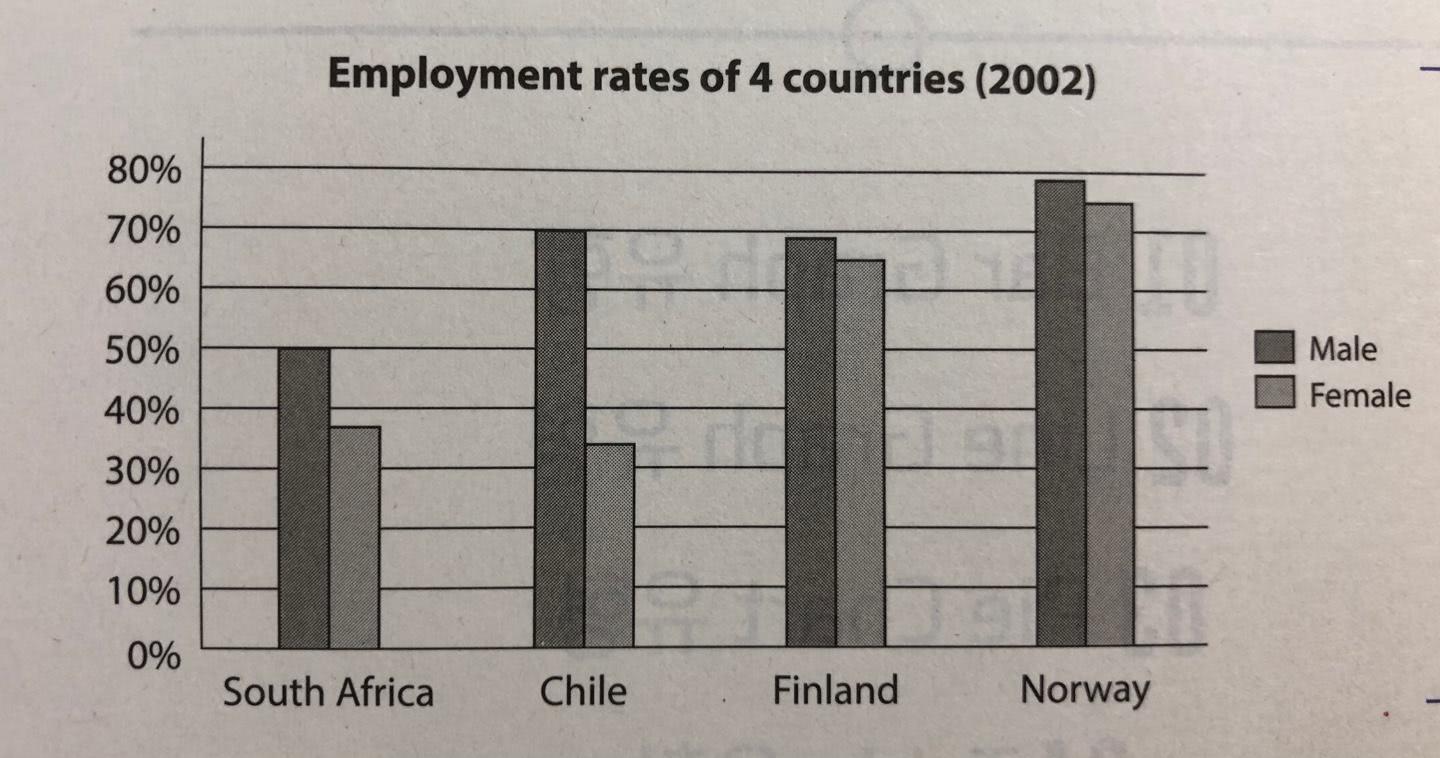
The bar graph illustrates the percentage of employment of each gender in South Africa, Chile, Finland, and Norway for the year 2002.
Overall, it is clear that in all countries the proportion of male's employment was higher than that of female's employment in the 2002. While South Africa and Chile showed significant disparity of employment rate between male and female employees, Finland and Norway had relatively less slight differences between male and female workers.
Looking at the chart more closely, one can see that the employment percentage of female and male employees in Norway was significantly higher than those of the other three countries with 75 percent and just under 80 percent, respectively. In contrast, South Afirca has the lowest share of employment rate. In the case of Finland, it had the similar proportion of employment rate between male (69 percent) and female (65 percent) employees. Lastly, Chile had 70 percent of male workers which doubled 35 percent of female workers. Among four countries, it had the most outstanding gap between female and male employment rate in 2002.
----------------------------------------------------------------------------------
작성시간: 14분 5초 글자수: 182 words
첫 문단 첫 문장 복수랑 두번째 문단 in all countries 빼먹은거 비롯해서 실수가 많아요 ㅠㅠ
목표 점수는 6.5 입니다! 교재 모범 답안이 있었지만 제 스스로 보지않고 먼저 써보았습니다!
첨삭 감사드려요.
총평: (7/7/6/6) 6.5
실수가 많다고 하셨는데 사실 이정도면 거의 실수가 없는 편입니다. 내용 분석 등은 잘 해주셔서 6.5에는 도달할 수 있을 것이고요. 대신 실수가 없는 것에 비해 표현과 문장구조가 다소 단조로운 편인데, 이에 대해서는 모범답안을 많이 보시면서 다양한 표현과 문장구조를 익혀주시면 됩니다. 글에 대한 요령은 제가 그때그때 체크해드릴테니까 라이팅어려워님은 어휘+문법에 집중해주세요!
수고하셨습니다 :)

 비밀번호 확인
 댓글 0개
댓글 0개


 불편사항 신고