


 인쇄
인쇄


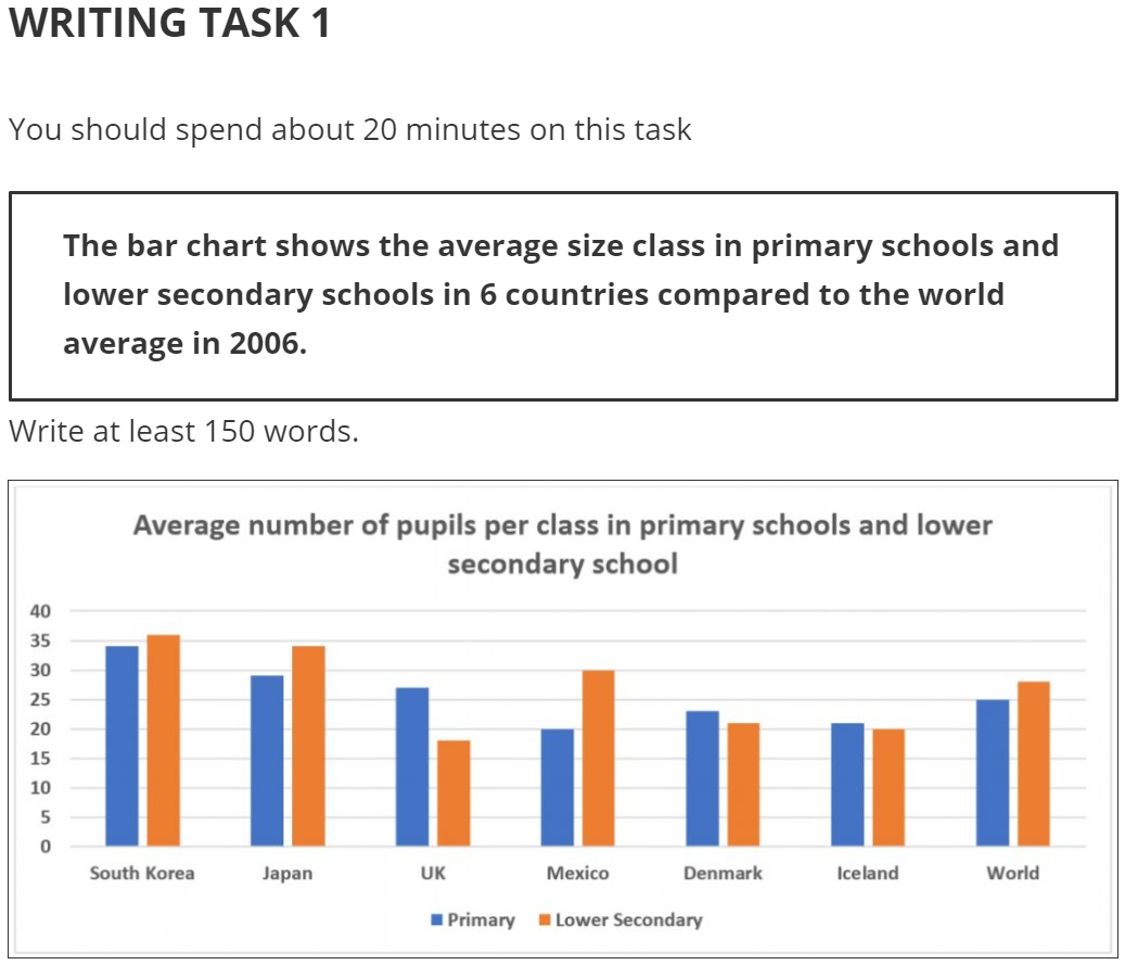
This bar chart illustrates the number of
students per class of primary schools and lower secondary schools of six
countries, by comparing compared with the average number of those students throughout
the world in 2006.
Overall, it is clear that both of the
figures for two Asian nations – South Korea and Japan – surpassed those for all
nations, making differences from about 5 people to 10 people in primary school
section and over approximately 5 people in middle school section, respectively.
Conversely, in Denmark and Iceland, a the smaller number of pupils per class was
enrolled than that of the world’s average value, as gaps of about 3 people in
elementary school and roughly 8 people in middle school. (Overview가 너무 깁니다. 짧게, 폭넓게 포괄만 해주시고, 특히 Overview에서는 구체적인 수치가 들어가지 않으므로 이에 대해 주의해주세요! 구체적인 수치는 밑에서 언급해주시면 됩니다.)
Finally To be specific, the mean figure for schools where
lower age students commute showed only a was little difference between the United Kingdom and the
world, but, in case of lower secondary school, less 10 less (이거 잘못하다가 의미가 완전히 달라질 수 있으므로 주의해주세요~) people are in one classroom, compared comparing with the world’s figure. On the contrary, the average value of Mexico
in primary school fell behind that of the world by about as 5 people, and meanwhile, in
terms of middle school, Mexico slightly exceeded the world, as only about 2
people.
총평: (6/7/7/6) 6.5
모리스님 되게 오랜만에 오신 것 같네요~
일단 큼지막하게 문제가 되는 부분은 없었는데, 위에서 말씀드렸듯이 Overview에 대한 조정은 필요합니다. 지금 Overview는 사실상 overview의 탈을 쓴 세부 분석에 불과합니다. 세부 분석과 확실한 차이를 두기 위해서, 보다 폭넓게, 짧게, 포괄적으로 작성해주세요! 이게 Overview의 대원칙입니다.
수고하셨습니다 :)

 비밀번호 확인
 댓글 0개
댓글 0개


 불편사항 신고