


 인쇄
인쇄


The graph below shows the employment rate of each gender in four different countries in 2002.
Summarize the information by selecting and reporting the main features, and make comparisons where relevant. Write at least 150 words.
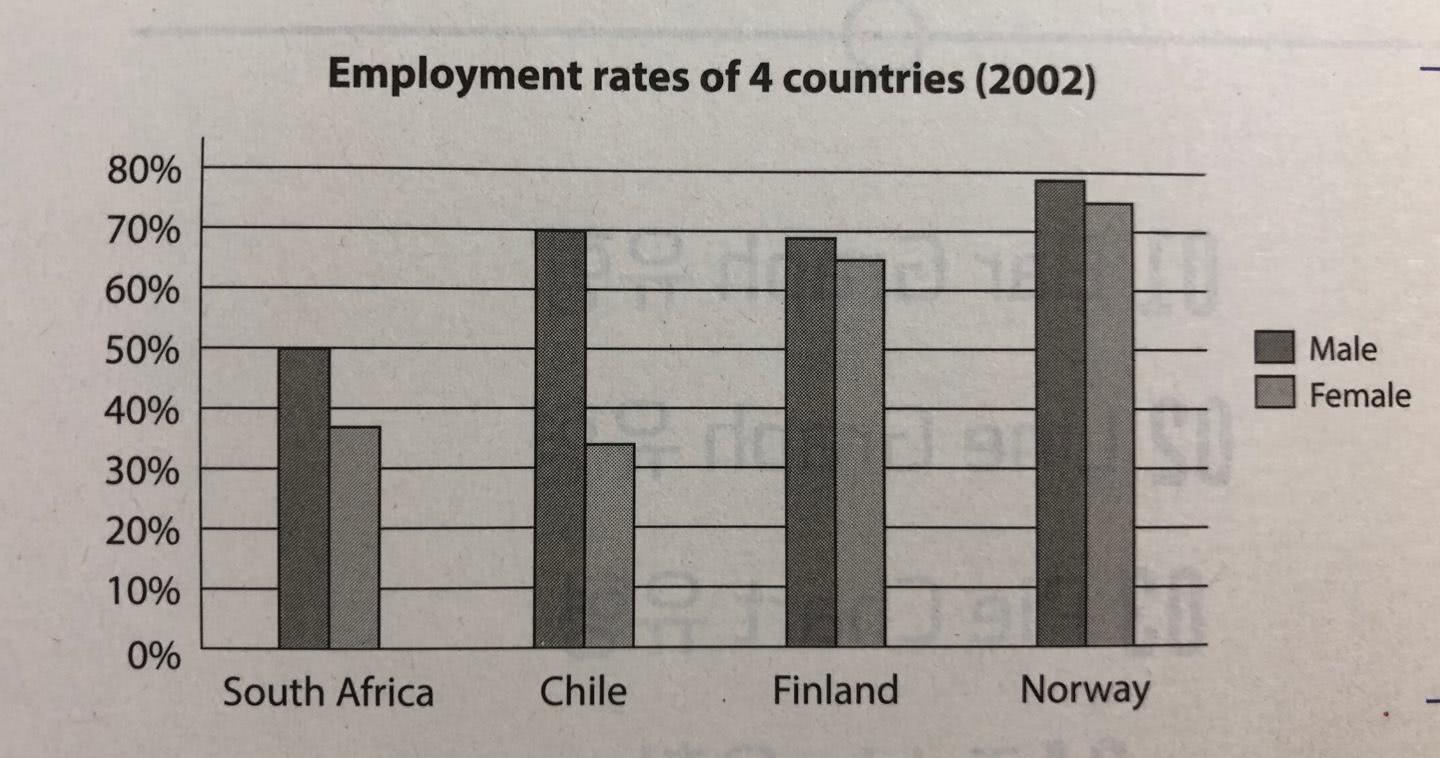
The given bar graph gives information about the
employment rate of each sex in four different countries namely, South Africa,
Chile, Finland, and Norway, (이런 거 생략하면서 시간 줄이시면 됩니다.) in 2002.
Overall, it is evident that the employment rate of Norway
was the highest for both males and females. In addition, the rate of male men employees
was higher than that of women employees in each country in the year 2002.
Looking at the graph more closely, one can see that the gap
of employment rate between men and women was almost similar at 4 percent (그 어떠한 수학도 하지 마세요!) in Finland
and Norway in 2002. In Norway, the figure of male employment by male was the highest at just under less than 80 percent. As for Finland, the men employment rate of ment was at around 69
percent, which was slightly lower than the rate of Chile chile’s male employment in
the same year.
In contrast, there was the lowest rate in the employment of
men at 50 percent in South Africa in 2002, and the female employment rate in South
Africa was approximately 37 percent, which was higher than Chile chile’s employment
by women in the year 2002.
25분 걸렸어요.
간단한거같은데 빨리 안써지더라구요ㅜ_ㅜ
총평: (6/7/5/6) 6.0
이번 글은 어휘가 제한적이서 조금 아쉽긴 했지만, 그래도 5점대 떨어질 일은 없을 겁니다. 수학 계산은 따로 하지 마세요!
수고하셨습니다 :)

 비밀번호 확인
 댓글 0개
댓글 0개


 불편사항 신고