


 인쇄
인쇄


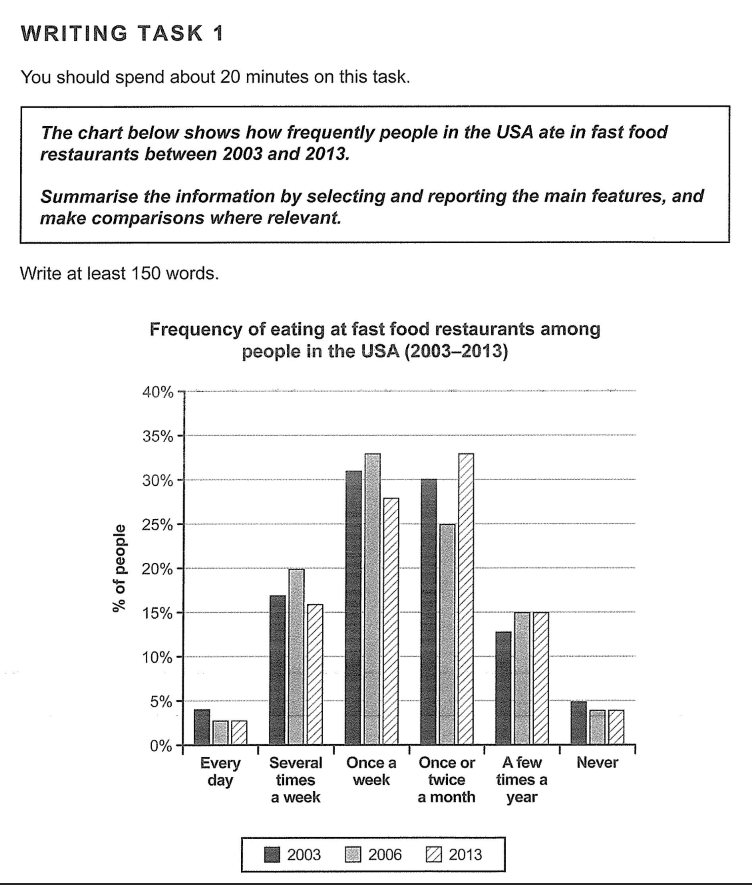
The given chart shows how often Americans eat at fast food restaurants from 2003 to 2013.
The most significant feature is that more than 30 percent of Americans enjoyed eating out once a week in 2003 and 2006. While, this number slight fell when eating once or twice a month in the same year, it increased more than 10 percent in the following year 2013. But the fact had not changed that these two frequency, which is once a week and once or twice a month, granted the highest figures of all.
On the other hand, only 15 to 25 percent of people went out for food several times a week. Although the percentage was slightly higher in 2006, they remained relatively stable during the period. The second-lowest group is the percentage of a few times a year visited restaurants, fluctuated over 10 to 15 percent. Finally, every day and never eating at restaurants remained the lowest figure which was 0 to 5 percent over the period.
To sum up, the graph illustrates that most people eat once a week and once or twice a month at restaurants. While, the proportion was extremely low at every day and never, each were less than 5 percent.

 댓글 0개
댓글 0개


 불편사항 신고