


 인쇄
인쇄


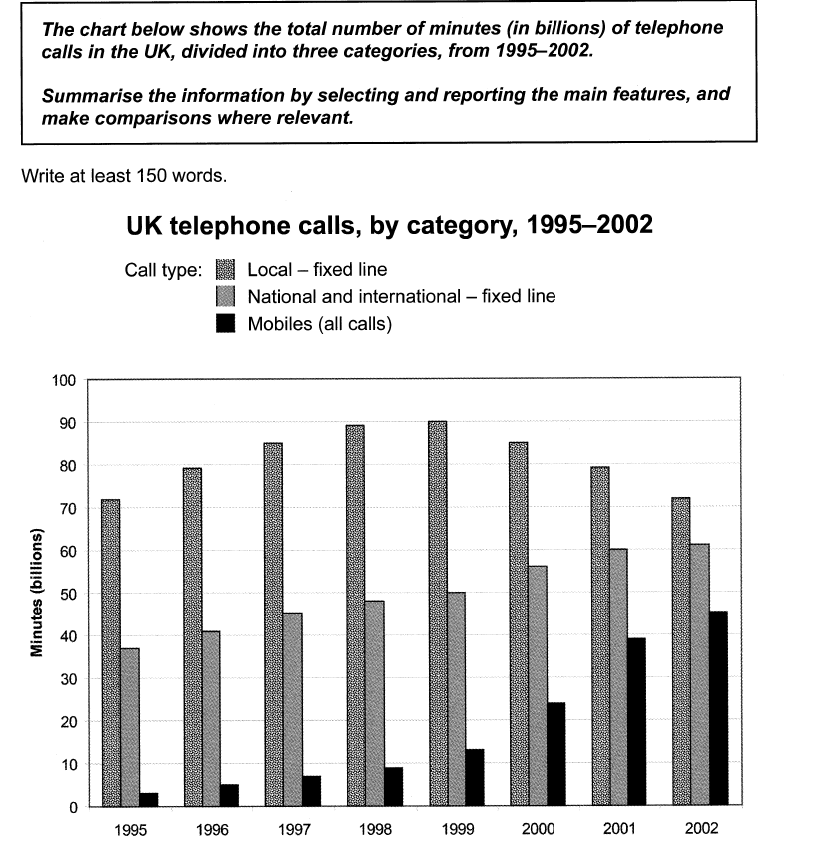
The bar chart shows the total minutes of
telephone calls of local, national and international and mobiles calls from 1995
to 2002 in the UK.
It is obvious that the order of list had
not changed throughout the whole years in the chart which the most minutes of
calls were made through local lines, is local, national and international had maintained the second highest position. Even
though there was a significant increase to mobile calls minuets, it was located
at the last.
Looking at the chart more closely, the
minutes of local calls gradually increased from 1995 to 1999. However, from
2000, it got started to decrease to 2002. While local calls experienced a fluctuation, the figure of national and international calls and mobiles sustainably went up
every year. Particularly, mobiles calls dramatically rose in number raised by 30 billion minutes from
1999 to 2001. In 2001, the combined figure of national and international and mobiles calls
surpassed local calls. In the last year in that chart, there were not enormous
differences between call types, compared to the past than before.
총평: (5/7/6/6) 6.0
TASK1에서는 서론을 제외하고 봤을 때 분석을 하는 문단이 두 개가 있습니다. 첫 번째는 OVERVIEW이고 두 번째는 세부적인 문단, 즉 지금으로 치면 마지막 문단이 되겠죠. 이때 전자에는 구체적인 수치가 들어가서는 안 되는 반면, 후자에는 오히려 구체적인 수치의 인용이 필요합니다. 따라서 지금 마지막 문단에도 구체적인 수치를 넣어주세요~
수고하셨습니다 :)

 비밀번호 확인
 댓글 0개
댓글 0개


 불편사항 신고