


 인쇄
인쇄


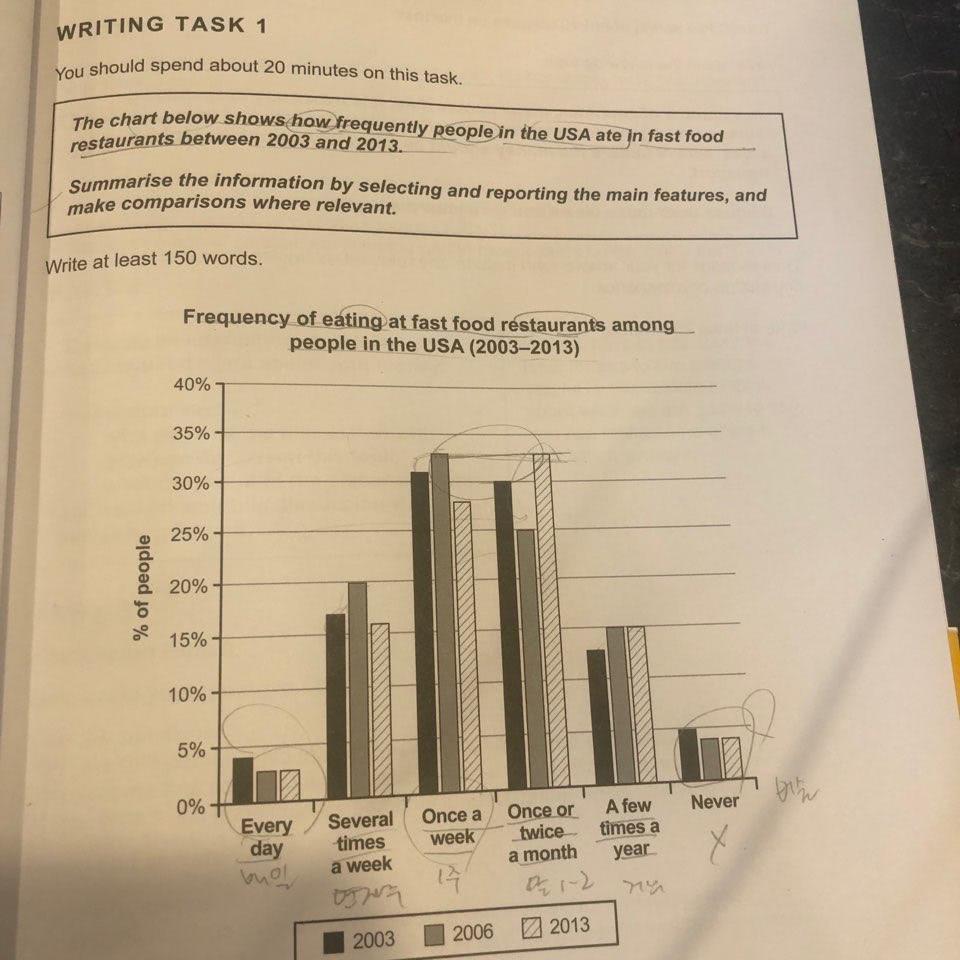
The bar graph illustrates how often people eating fast food at restaurant in United States of America in 2003,2006 and 2013.
The overall trend we can see from the graph is that the number of once a week was highest which was followed by once or twice a month's,while the figure of Every day and Never was lowest during the research period.
As to the details, the number of people who eating fast food once a week increased slightly approximately 2% and peak at 33& in 2006.This was followed by the figure of eating once or twice people a month went up sizably roughly 8% also,which was the highest in 2013.
Turning to rest figures, the number of eating several times a week people was seen similar trend with once a week, A few times a year of eating people rose slightly and remained relatively stable between 2006 and 2013, interestingly the figures of Every day and Never was lowest and similar pattern was seen over the period.
첨삭 부탁드립니다. 감사합니다 : )

 댓글 0개
댓글 0개


 불편사항 신고