


 인쇄
인쇄


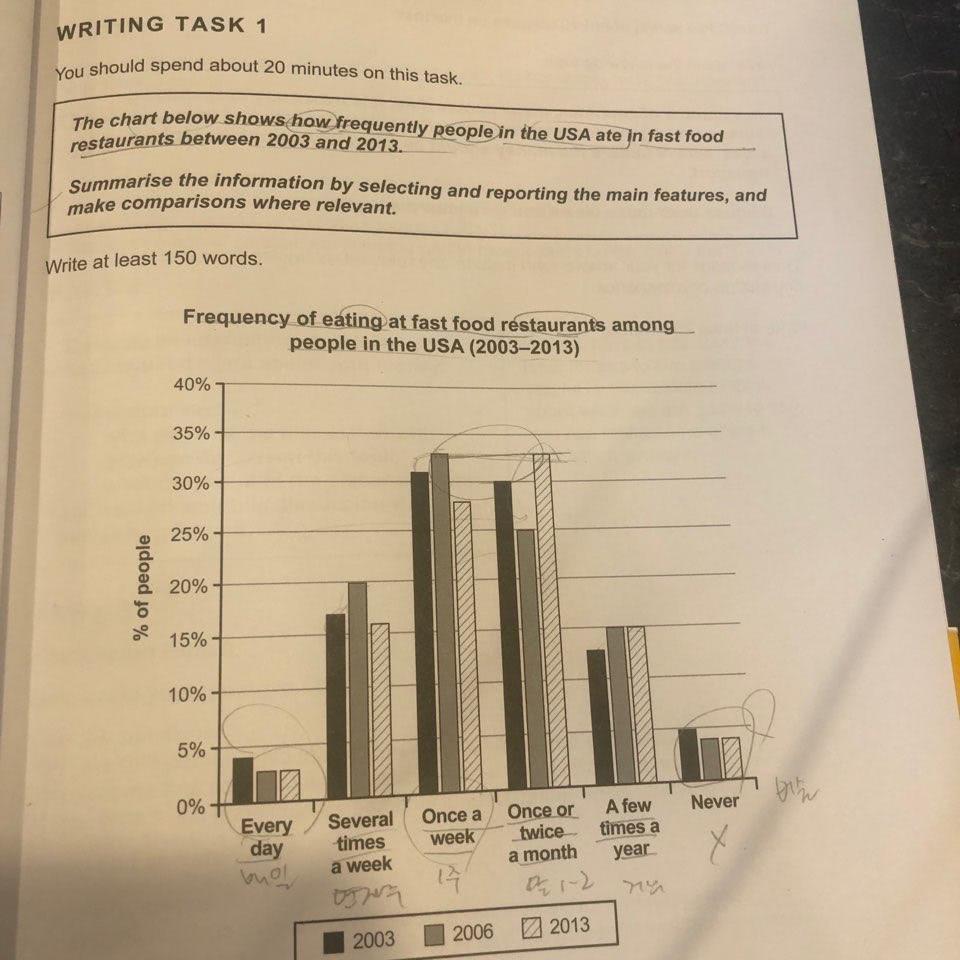
The bar graph illustrates how often people ate in eating fast food at restaurants in the United States of America in 2003,(지금 쉼표 뒤 단어를 쉼표와 붙이신 상태인데, 그렇게 해서는 안 되고 쉼표와 띄어주셔야 합니다. 다른데에도 다 띄어주시면 돼요.)2006 and 2013. (여기서는 엔터를 한번 더 쳐주세요! 이것도 다 점수에 들어갑니다.)
The overall trend we can see from the graph is that the number of once a week was highest which was followed by once or twice a month's,while the figure of Every day and Never (이 친구들은 소문자 시작입니다.) was lowest during the research period.
As to the details, the number rate (여기는 매우 중요한 사항인데, 이에 대해서는 링크를 하나 넣어드리겠습니다.) of people who eating ate fast food once a week increased by slightly approximately 2% (얘도 링크를 하나 드리겠습니다.) and peaked at 33&% in 2006 .This was followed by the figure of eating once or twice people a month went up sizably roughly 8% also,which was the highest in 2013.
Turning to the remaining rest figures, the number rate of people that had fast food eating several times a week people was seen a similar trend with that of once a week, A few times a year of eating people while the figure of a few times a year rose slightly and remained relatively stable between 2006 and 2013, interestingly the figures of Every day and Never (얘네도 소문자 시작입니다.) was lowest and similar pattern was seen over the period. (지금 무려 세 줄이 하나의 문장으로 들어가있는 상황인데, 이럴 경우 좋지 않습니다. 문장은 최대한 짧고 간결하게 가주세요!)
첨삭 부탁드립니다. 감사합니다 : )
총평: (5/6/6/5) 5.5
Task1에서 많은 학생들이 틀리는 사항이자, 정말 중요한 사항들 몇 가지가 이 글에서도 문제가 되었는데, 제가 이에 대해서는 따로 정리해놓은 글이 있으니 그걸 참고해주시면 큰 도움이 될 겁니다. 또한, 아직 문법이 완전히 깔끔한 상황은 아니기 때문에 글을 쓰는 것과 별개로 문법 공부도 꼭 해주세요!
수고하셨습니다 :)
https://www.gohackers.com/?c=ielts/ielts_info2/ielts_writing&type=url&uid=461474
https://www.gohackers.com/?c=ielts/ielts_info2/ielts_method&type=url&uid=486596

 비밀번호 확인
 댓글 0개
댓글 0개


 불편사항 신고