


 인쇄
인쇄


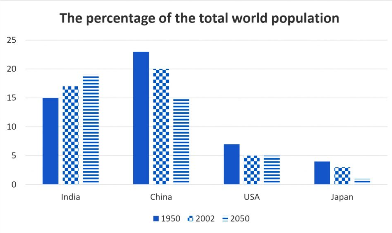
The given graphs depict the percentage of the total world population
taken by four countries in the year of 1950 and 2002 with the projections on
2050. In general, only India will increase the proportion India will show an increase in proportion (인도라는 국가가 주체적으로 인구를 증가시키지는 않기 때문에 적절하지 않습니다.) it takes while the
other three countries which are China, USA, and Japan will lose its percentage during
the given period.
To be specific, India, the second largest country in population
among given countries in 1950 with the figure of 15% will going to increase the
figure until it reaches 19%. (여기도 능동이 쓰여서는 안 됩니다.) However, China, which claimed the biggest
proportion of population in 1950 with a figure of 23% of figure will yield its top status
to India as the figure is expected to decrease to 15%. Meanwhile, the other two
remaining countries also going to experience the cut back in its percentage
kept in the world’s total population. For USA, the percentage point it holds is
going to be changed from 6% to 5% while Japan shows huge drop into a quarter
from 4% to 1% in the same period.
총평: (6/7/7/6) 6.5
크게 문제가 있는 건 아니었는데, 내용의 경우 너무 1950년, 그리고 2050년에만 집중되어있는 경향이 있기 때문에 2002년이 의미있는 경우는 꼭 넣어주셔야 합니다. (미국, 일본 쪽이 의미가 있습니다.)
또한 문법의 경우는 능동 쪽만 조금 수정해주세요~
수고하셨습니다 :)

 비밀번호 확인
 댓글 0개
댓글 0개


 불편사항 신고