


 인쇄
인쇄


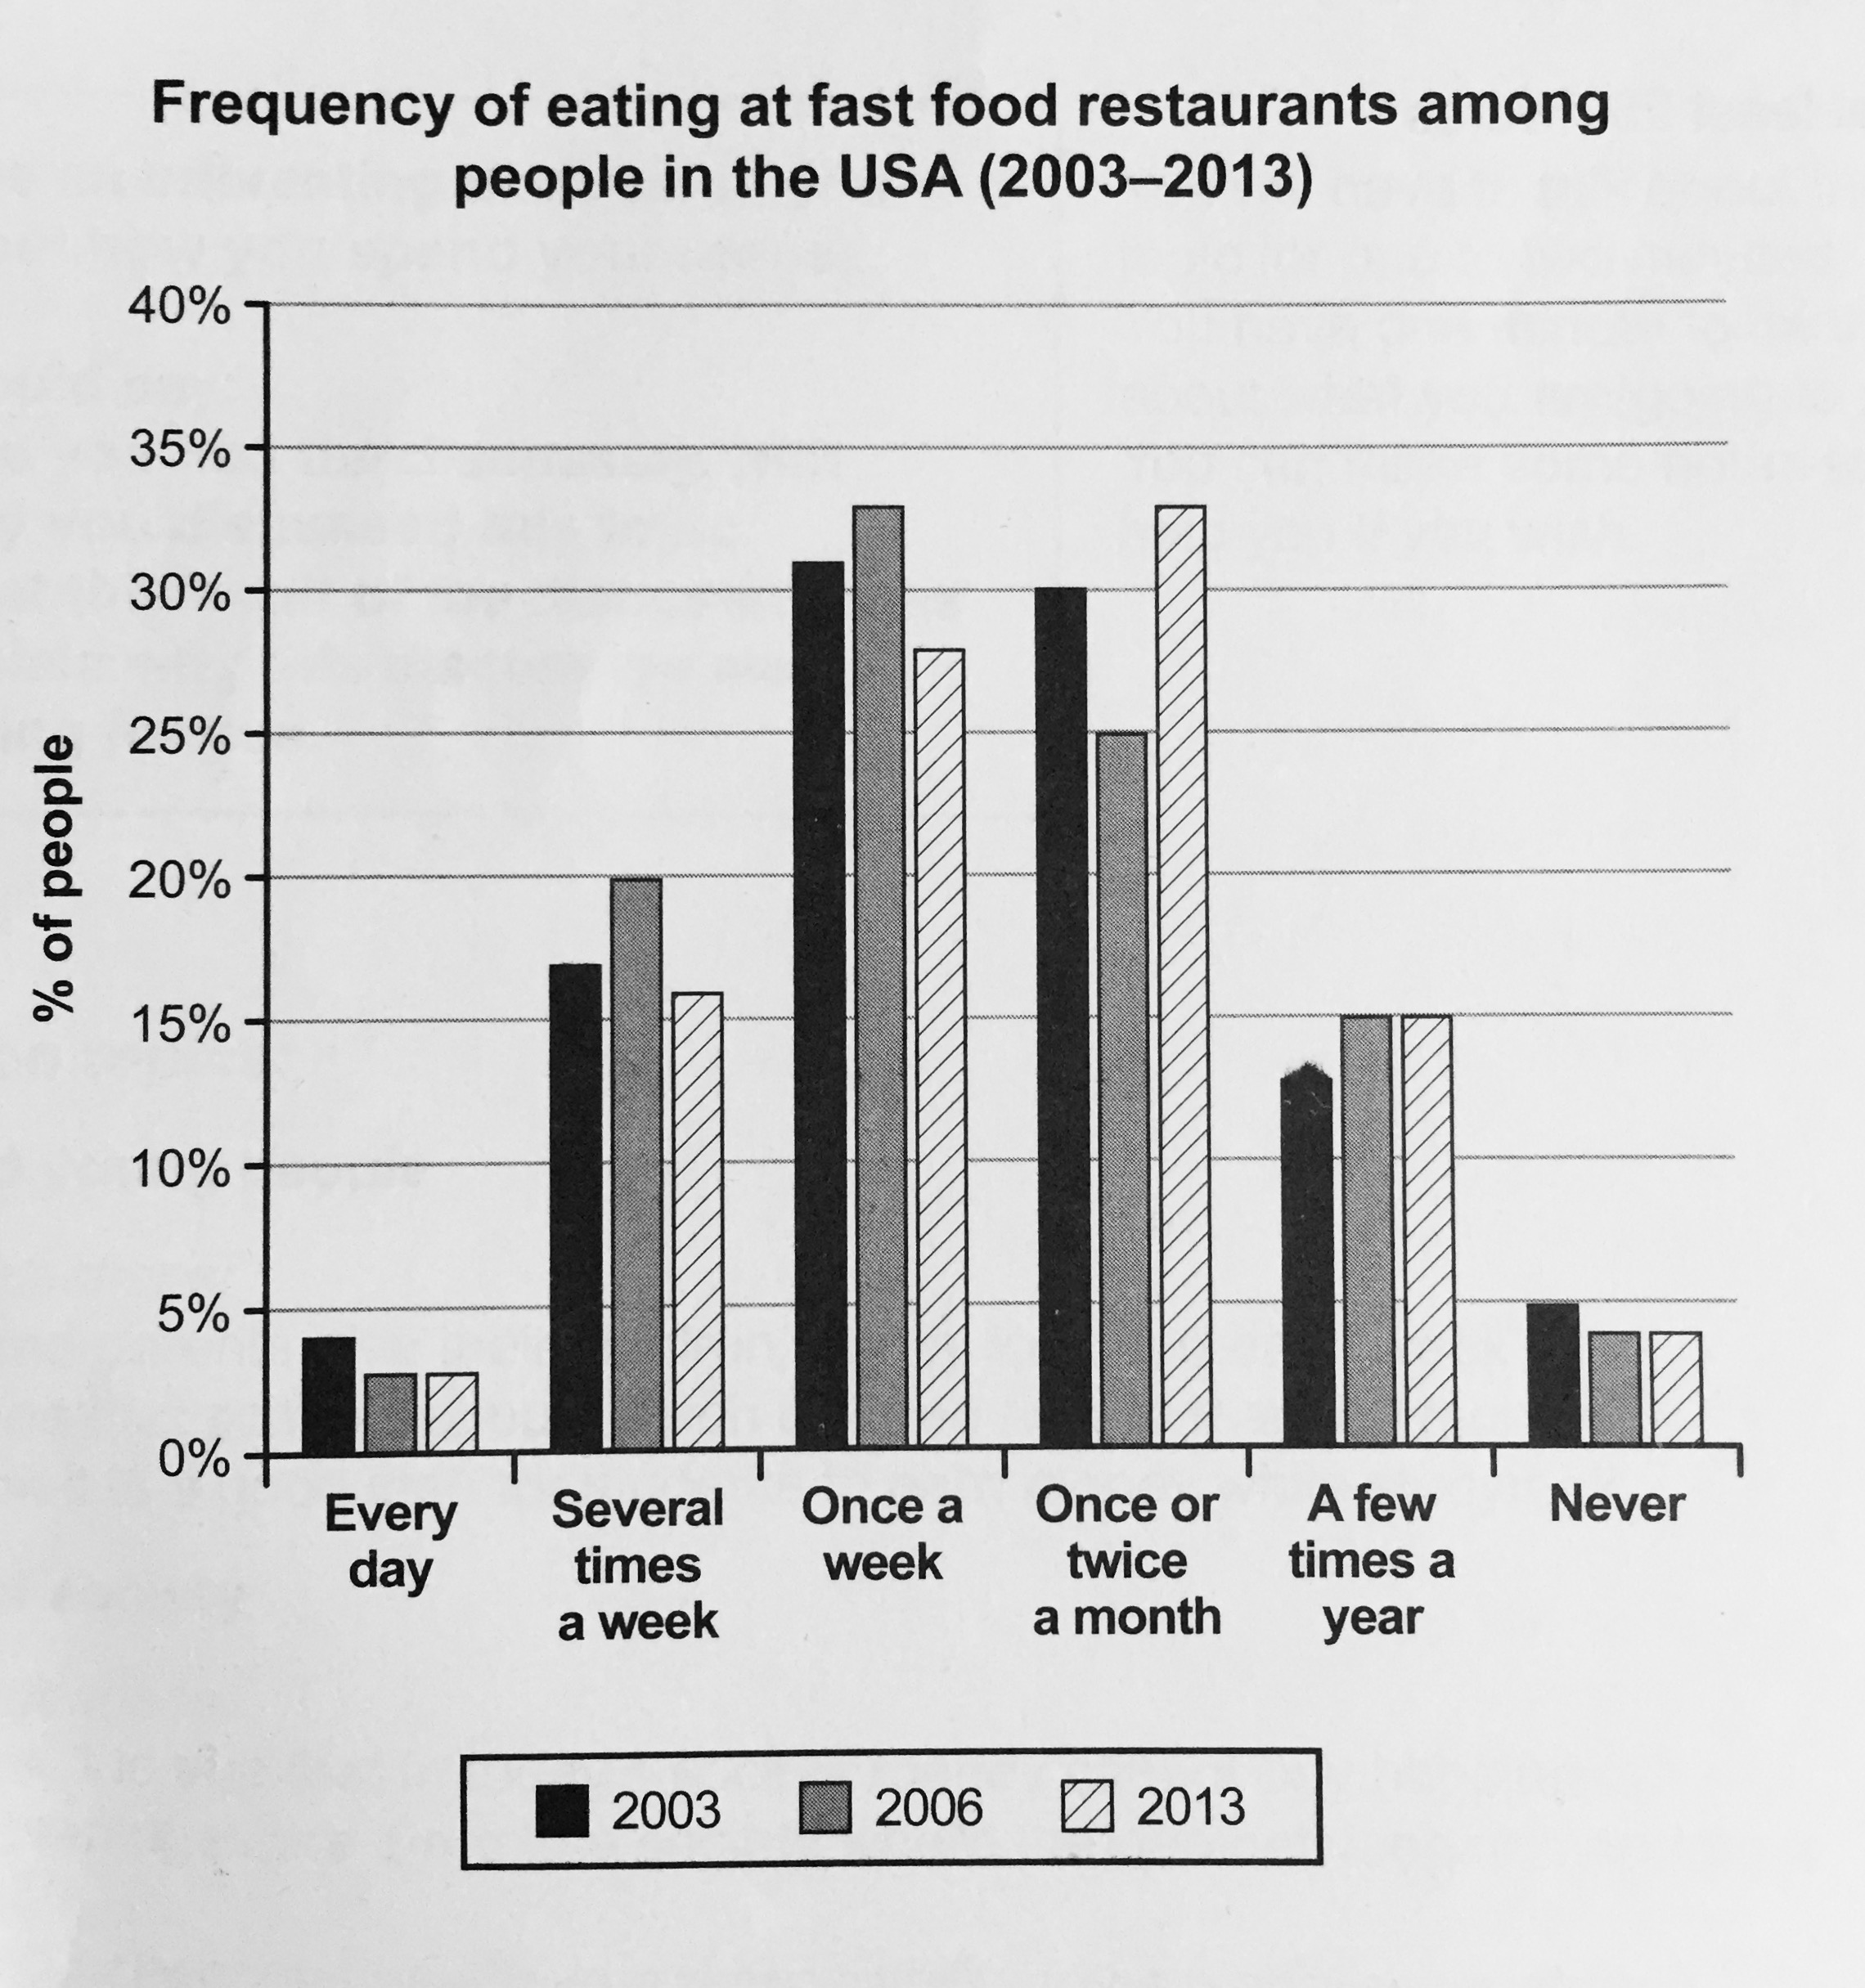
This bar chart shows that how often people in the USA eat fast food with 6 sections of frequency in 2003, 2006 and 2013 each.
Overall, it is clear that all of bars in this graph illustrate similar changes regardless of the year.
In further detail, most people who went to the fast food restaurants once a week and once or twice a month account for nearly over 25% in all of the years as above. On the other hand, some people who have been there every day or never take up for less than 5% in the same period.
To be specific, the two periods which are 2006 and 2013 ranked top on the two of sections which are once a week and once or twice a month with over 30%. Furthermore, the proportion of groups who eat fast food every day, a few times year and never constitute the same percentage.
총 153단어
시간 22분
두번째 문단을 보충한다는게 시간이 부족해서 그냥 디테일만 써버렸어요 큰 감점요소인가요?ㅠㅠ

 댓글 0개
댓글 0개


 불편사항 신고