


 인쇄
인쇄


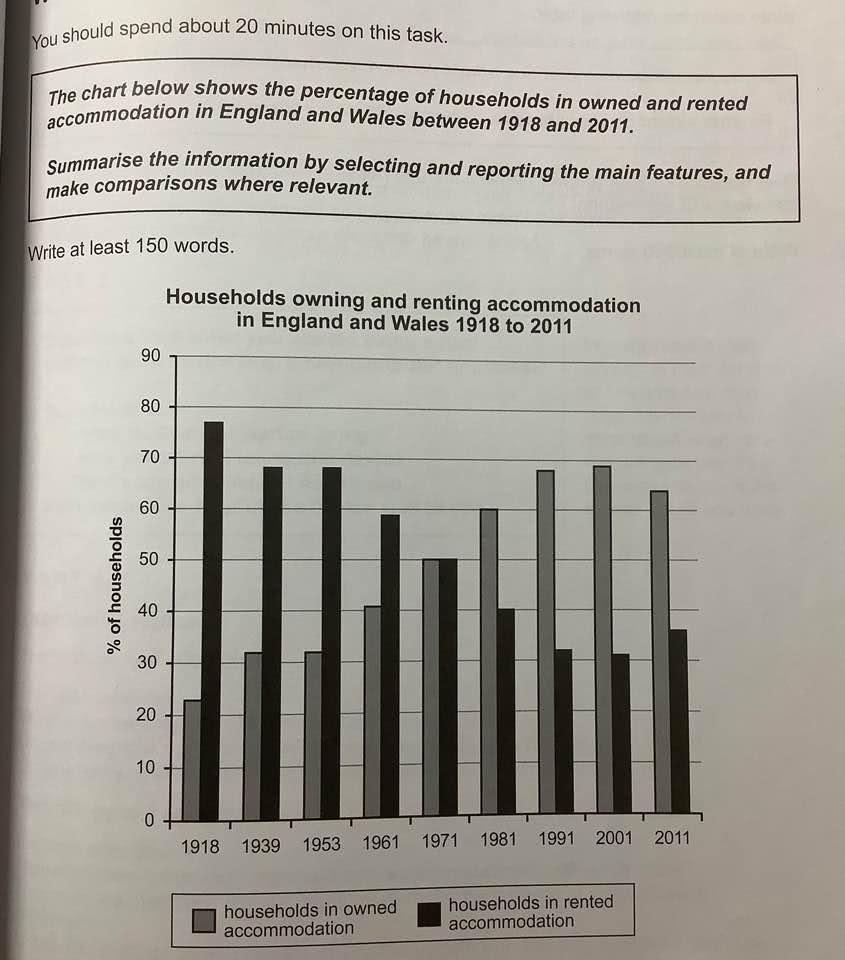
The bar graph illustrates the proportion of households owning and renting accommodation in England and Wales over the entire period from 1918 to 2011.
Overall, it is clear that there were many changes in terms of percentage of households between 1918 and 2011. The proportion of households in rented accommodation significantly had decreased by 2001, with a slight increase in 2011, whereas that of households in owned accommodation dramatically had risen throughout the period in question.
Looking at the chart more closely, one can see that the share of households in rented accommodation had showed an downward trend by decreasing from just under 80 percent in 1918 to 31 percent in 2001. In contrast, the rate of households in owned accommodation dramatically surged during the 93-year periods, overtaking the percentage of households in owned accommodation after 1971. Compared to the share of owned household in 1918, it had expanded by more than threefold by 2001, reaching its highest point of just under 70 percent. Then it experienced a slight decrease at the end of the period.
총 글자수: 178 작성시간: 12분 38초
이번에도 실수가 많네요 ㅠㅠ
목표 점수: 6.0 이상 받아야 하며 목표는 6.5!!
첨삭 감사드립니다 :)

 댓글 0개
댓글 0개


 불편사항 신고