


 인쇄
인쇄


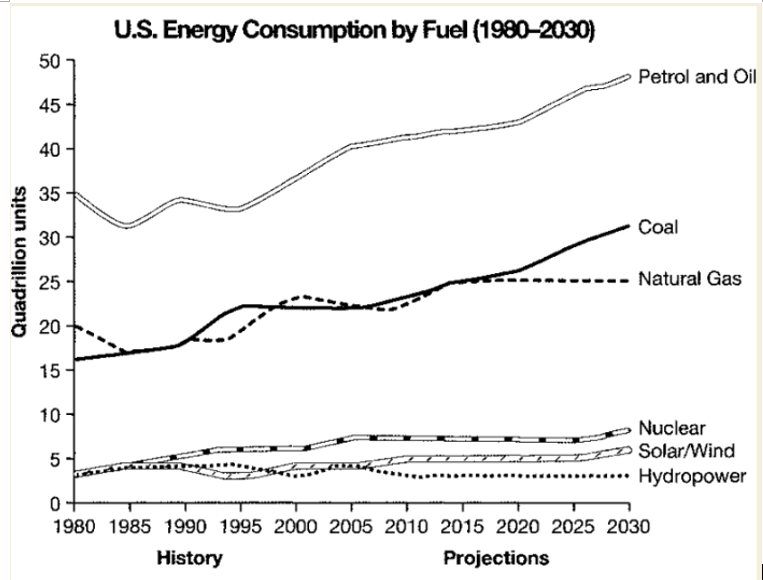
The line graph illustrates energy consumption of six kinds of fuels in U.S. between 1980 and 2030, based on historical data and expectations.
In general, except hydro power, the consumption of all five fuels is in the increasing momentum.
Petrol and Oil are dramatically increased, while nuclear, solar and wind slightly up and down. After 2010, hydro power and natural gas remain relatively stable level of consumption. Petrol, oil and natural gas had remarkable fluctuations between 1980 and 2015.
In terms of the amount of each fuels, petrol and oil shows the highest level of energy consumption all the time, and the coal and natural gas are entitled to belong in the middle group. And nuclear, solar, wind and hydropower are the lowest group of energy consumption level.
=============================
걸린시간 : 20분
목표 : 7.0
현재형과 과거형 중 어떤 것을 써야 하는지 고민이 많이 되었습니다.
오늘도 감사합니다.
좋은 하루 되세요.

 댓글 0개
댓글 0개


 불편사항 신고