


 인쇄
인쇄


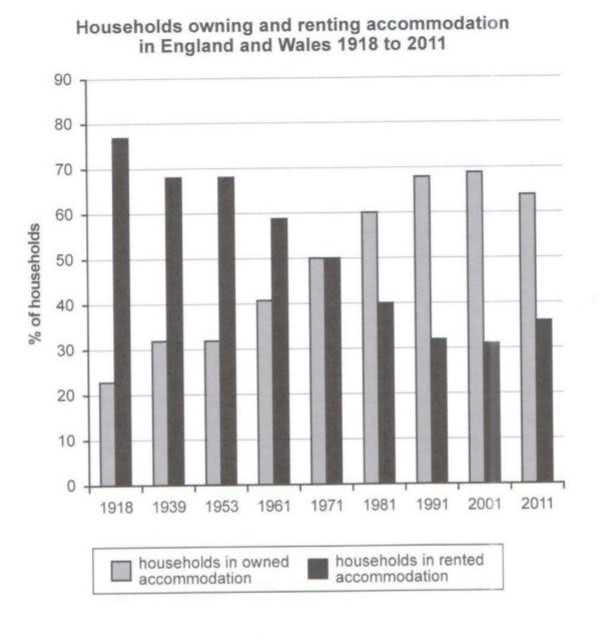
The graph displays the percent of chores in owned and rental residence in United Kingdom and Wales from 1918 to 2011. We can see immediately the chores in owned residence increased except in 2011 and household in rental residence declined except in 2011.
In contrast, in 1918 household in rental residence is most highest figure. But it shows downward trend by 2001 and in 2011 it increased. Moreover it remained there at around 69% in 1939 and 1953. Chores in owned residence lowest than the others. However, it illustrates upward trend by 2001 and the finishing the time surveyed in 2011 it decreased.
Here has a intriguing thing is that in 1971 each graphs held steady 50% respectively. Also, in 1918 chores in owned residence and household in rental residence are noticeable difference. The household in rental residence doubled than chores in owned residence. In addition all of the charts are higher than 20%.
소요시간 22분
글자수 155자
희망 점수 최소 4.0~5.0
시험날짜 11.8
템플릿 외워서 활용해서 썼습니다.

 댓글 0개
댓글 0개


 불편사항 신고