


 인쇄
인쇄


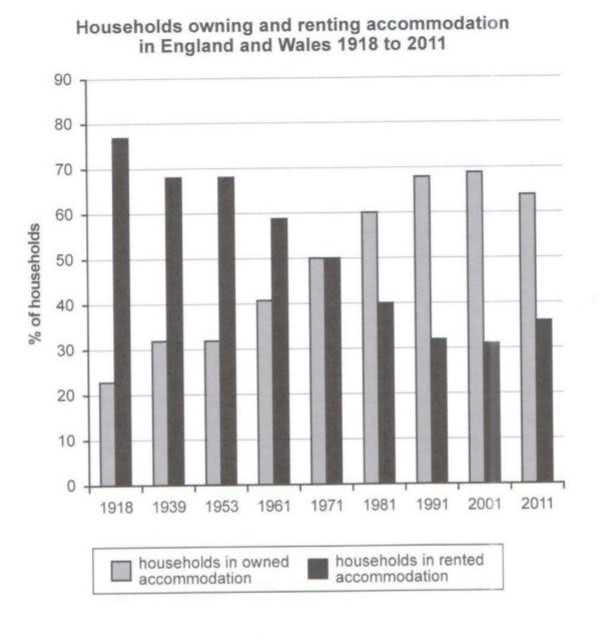
The graph displays the percent of households chores in owned and rental residence in United Kingdom and Wales from 1918 to 2011. In general, we We can see immediately that the chores rate in owned residence increased except in 2011 and that of households in rental residence declined except in 2011.
In contrast, in 1918 household in rental residence is most highest figure In 1918 the rate of households in a rented house shows the highest figure (most highest라는 표현은 존재하지 않습니다. 학생들이 많이 틀리므로 주의해주세요!). But it shows downward trend by 2001 and in 2011 it increased. Moreover it remained there at around 69% in 1939 and 1953. Chores The percentage of households in owned residence was the lowest in 1918 than the others. However, it illustrates an upward trend by 2001 and the finishing the time surveyed in 2011 it decreased.
Here has a An intriguing thing is that in 1971 each graphs showed held steady 50% respectively. Also, in 1918 chores in owned residence and household in rental residence are noticeable difference the two figures show a noticeable difference. The rate of households in rental residence doubled than chores in owned residence. In addition all numbers of the charts are higher than 20%.
소요시간 22분
글자수 155자
희망 점수 최소 4.0~5.0
시험날짜 11.8
템플릿 외워서 활용해서 썼습니다.
총평; (5/5/4/4) 4.5
초코님은 오늘부터 바로 실전 연습 들어가시면 됩니다. 사실 지금 7점 기준으로만 봐도 문제가 많긴 하지만, 4.0은 당연히 받을 수 있는 글이에요. 여기서 정확도만 조금 올라가면 5.0도 충분히 괜찮을 것이고요.
3점대는 진짜 절망적인 글이 아닌 이상 절대 나오지 않기 때문에, 편하게 준비하셔도 됩니다. 대신 11월 8일까지는 편하되, 자만하지 않는 마음으로 꾸준히 공부해주세요!
수고하셨습니다 :)

 비밀번호 확인
 댓글 0개
댓글 0개


 불편사항 신고