


 인쇄
인쇄


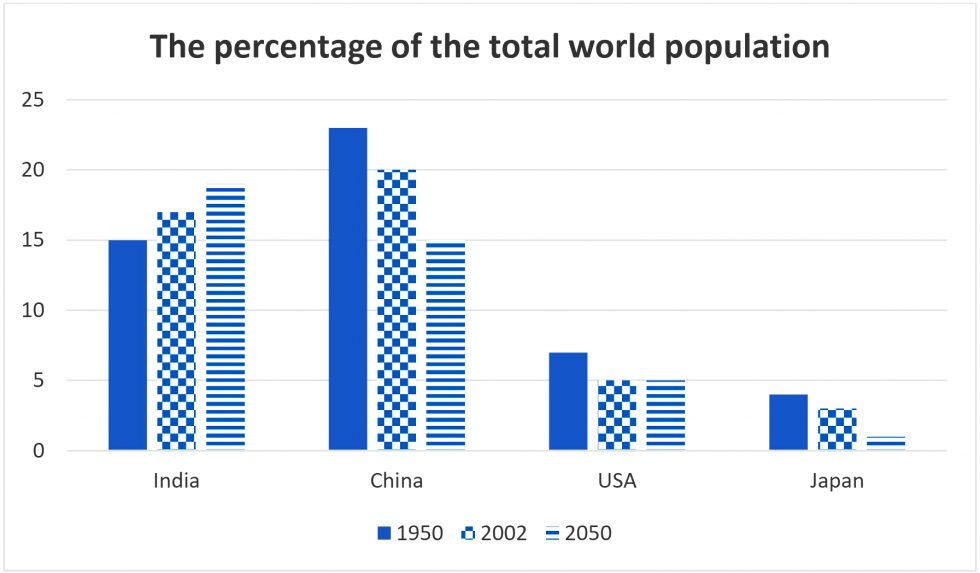
The chart below illustrates the percentage of the total world population of four distinctive countries in 1950, 2002 separately and anticipates this tendency in 2050.
Overall, only India shows a rising tendency of population, while the other countries show (여기도 그렇고, 전반적으로 조금 많이 쓰이는 상황이므로 대체해주시는 게 좋습니다.) a decreasing tendency from 1950 to 2050.
In 1950, the population rate of China was significant compared to the other three countries. It was nearly 19 percent points higher than that of Japan, and it showed a noticeable gap with India also, but it changed little by little from 2002. Although the difference was almost the same between China and the USA in 2002 compared to 1950, the gap became conspicuously closer dropped between China and India in the same period.
The flow finally will be reversed in 2050 by showing a noticeable change between the population percentage of India and China. In 2002, India’s population rate was about 5 percent points lower than that of China. This circumstance will be the opposite in 2050 that India’s population ratio indicates roughly (지금처럼 수치가 명확히 떨어지지 않을 경우, 임의로 확정짓는 것이 아니라, '대략' 이라는 표현을 추가해주셔야 합니다.) 8 percent points higher than that of China.
총평: (7/7/7/7) 7.0
크게 문제는 없었고, 반복되는 표현 정도만 대체해주시면 되겠습니다. 물론 show 하나가 조금 많이 쓰인다고 해서 감점이 훅 들어가는 건 아니지만, 그래도 두 번째 문단에서와 같이 한 문장에 두 번 쓰이는 것은 가급적이면 피해주시는 게 좋아요.
수고하셨습니다 :)

 비밀번호 확인
 댓글 0개
댓글 0개


 불편사항 신고