


 인쇄
인쇄


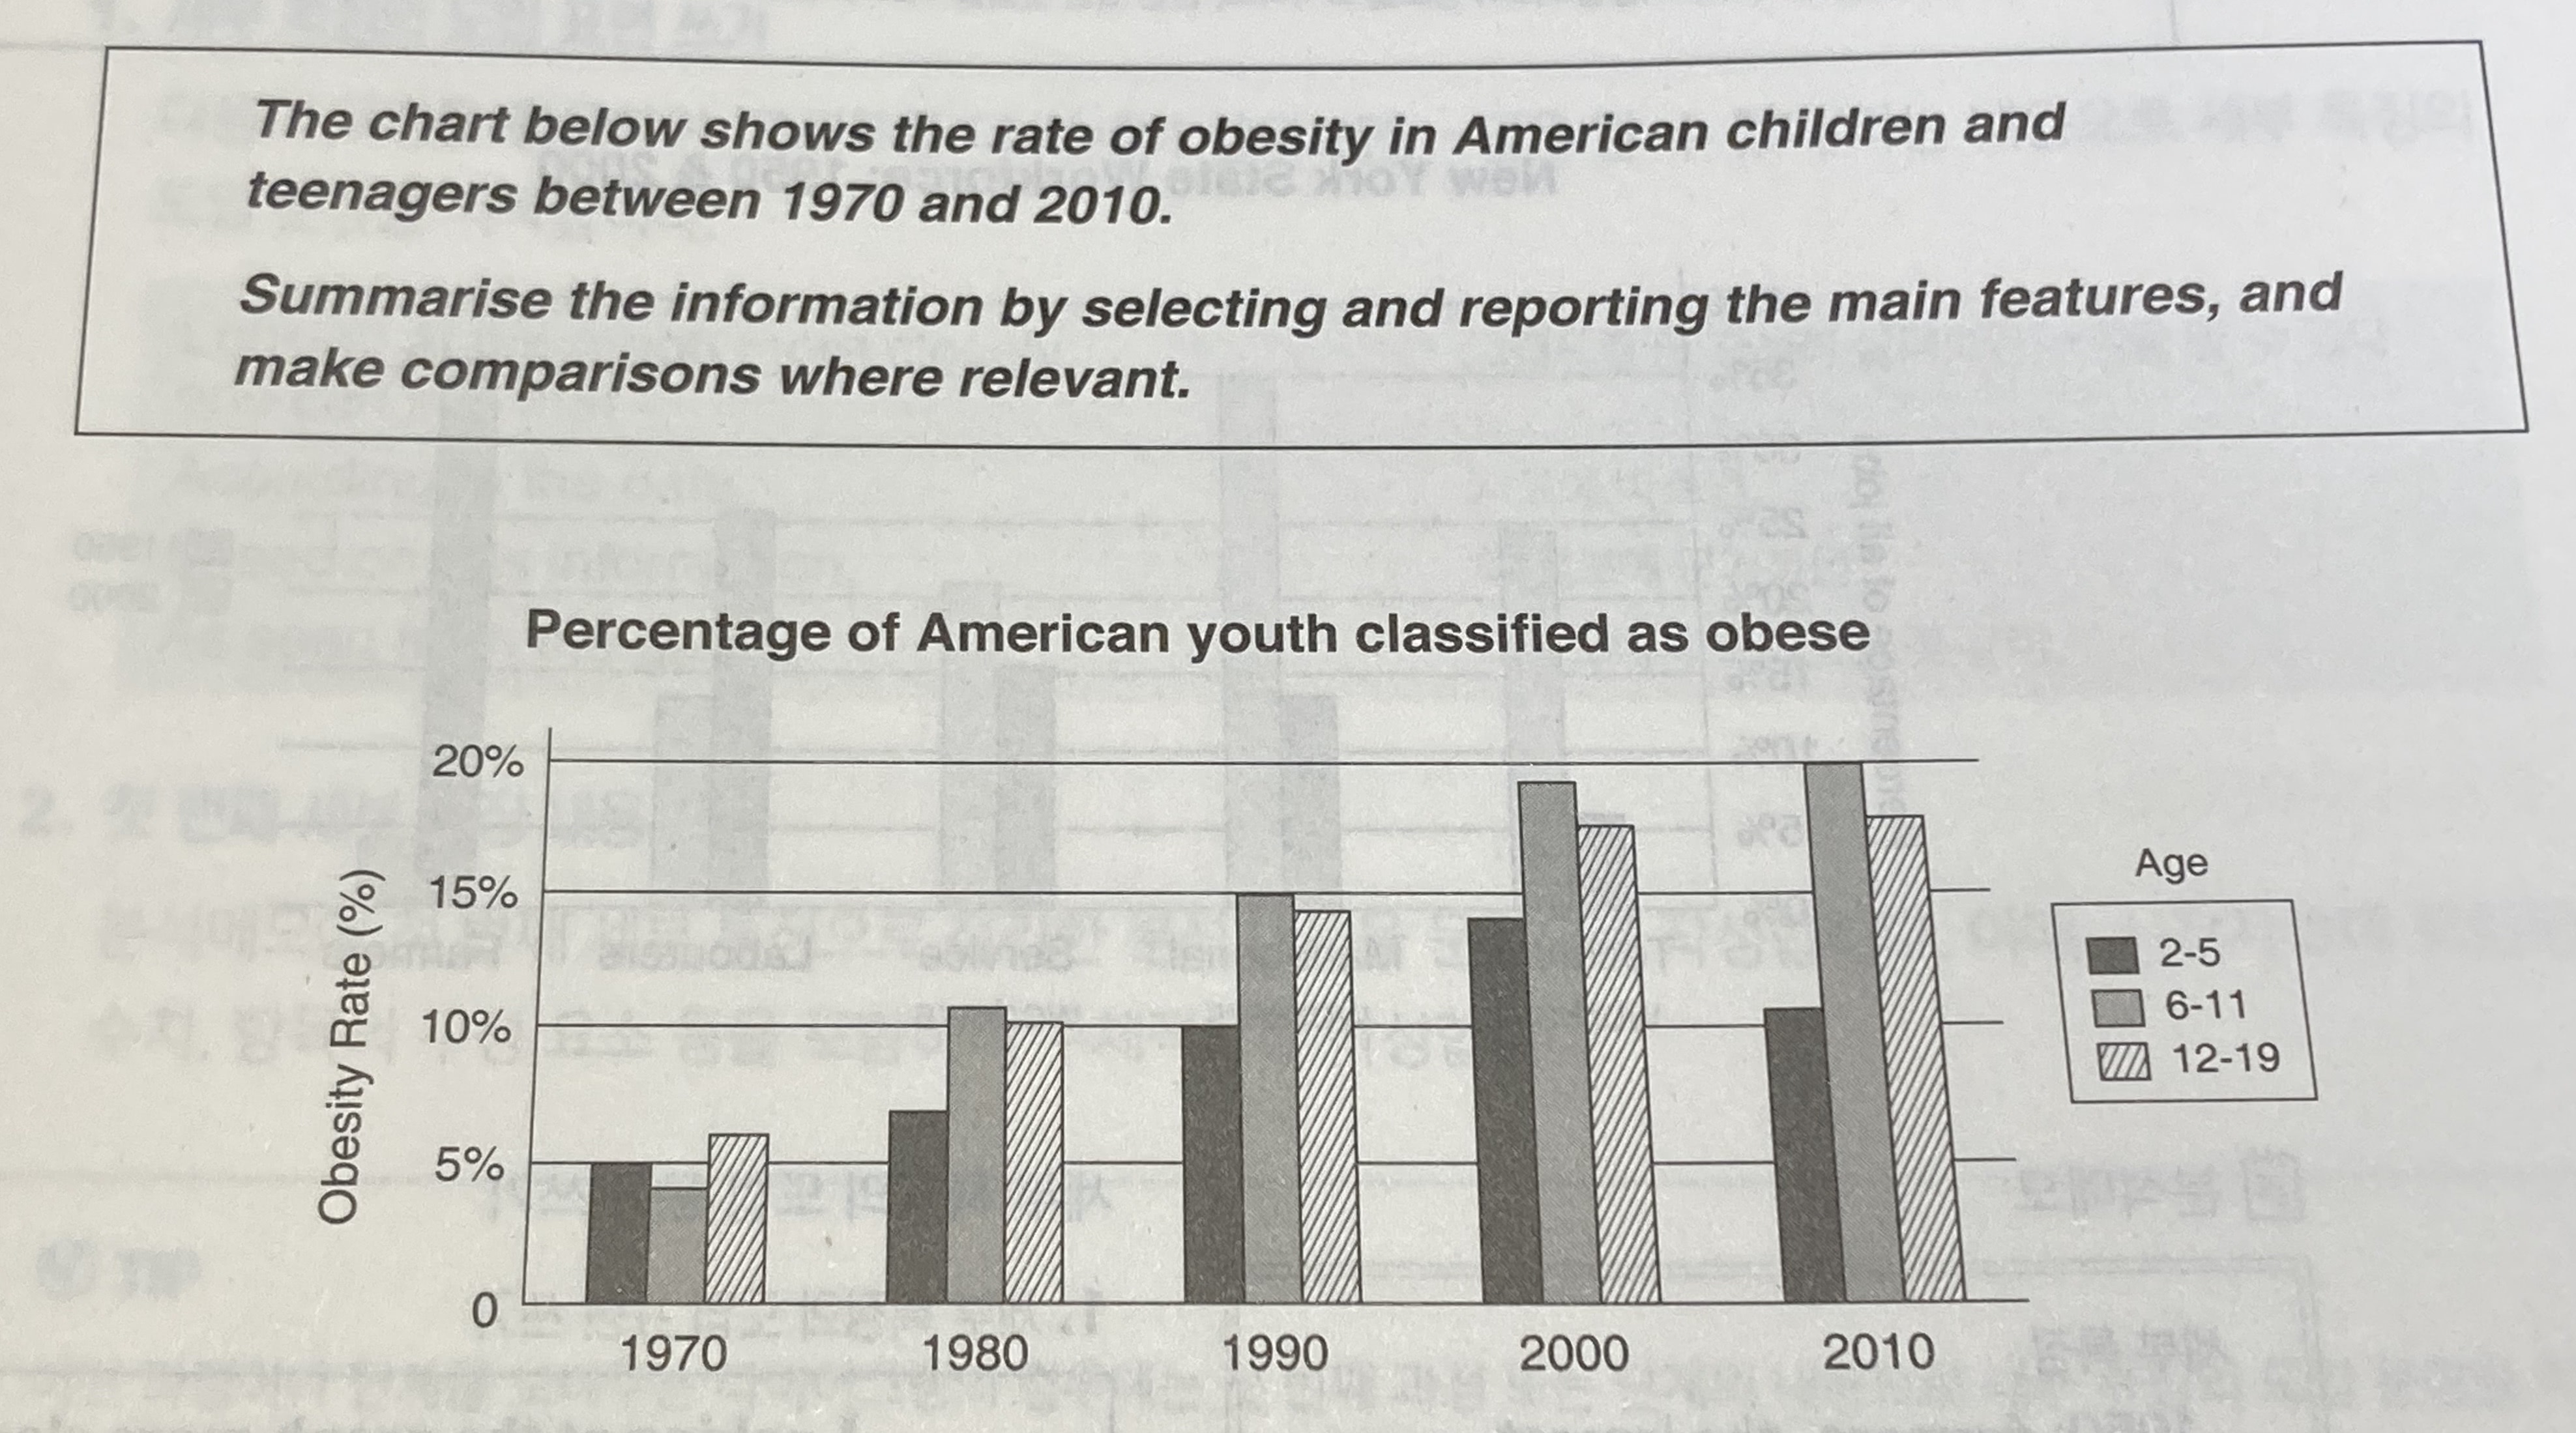
The chart shows the trend of proportion in each age band. It is interesting that all the figures have an upward trend and it is quite sharp.
In the
age of 2-5 kids, the obesity rate gradually increased and peaked at nearly 15% in
2000. After that, the figure went down to approximately 3%p in 2010. However,
the rate still remains ove 10%. Focusing on the 6-11 band, It seems the percentage
increased more sharply than the two to five band kids. It peaked at the end of
the period and that’s the maximum percentage of the whole graph. Lastly, the percentage
of the teenager band is very similar with the 6-11 group. The main features are
same as the graph has a sharp upward trend and hit the peak at the end.
To
compare the features, 2 to 5 kids group is relatively stable than the other
groups. The 6-11 band fluctuated the most.
* 목표 점수 : 6.0
* 시험 11월 말에 칠 예정이에요.
* 155단어, 17분 걸렸습니다. (사전 준비나 사후 첨삭 없는 글입니다.)
최근에 첨삭 받은 조언은 반영하지 못한 글이지만, Grammarly 없이 실전처럼 쓴 글로 평가 받아보고 싶어서 일단 올려봅니다!

 댓글 0개
댓글 0개


 불편사항 신고