


 인쇄
인쇄


우선 문제 화질이 안좋아서 죄송해요. 아이엘츠 공부 막 시작해서 task 1 처음 써봤는데 첨삭 부탁드립니다!
문제 화질은 아주 좋은 것 같습니다 :)
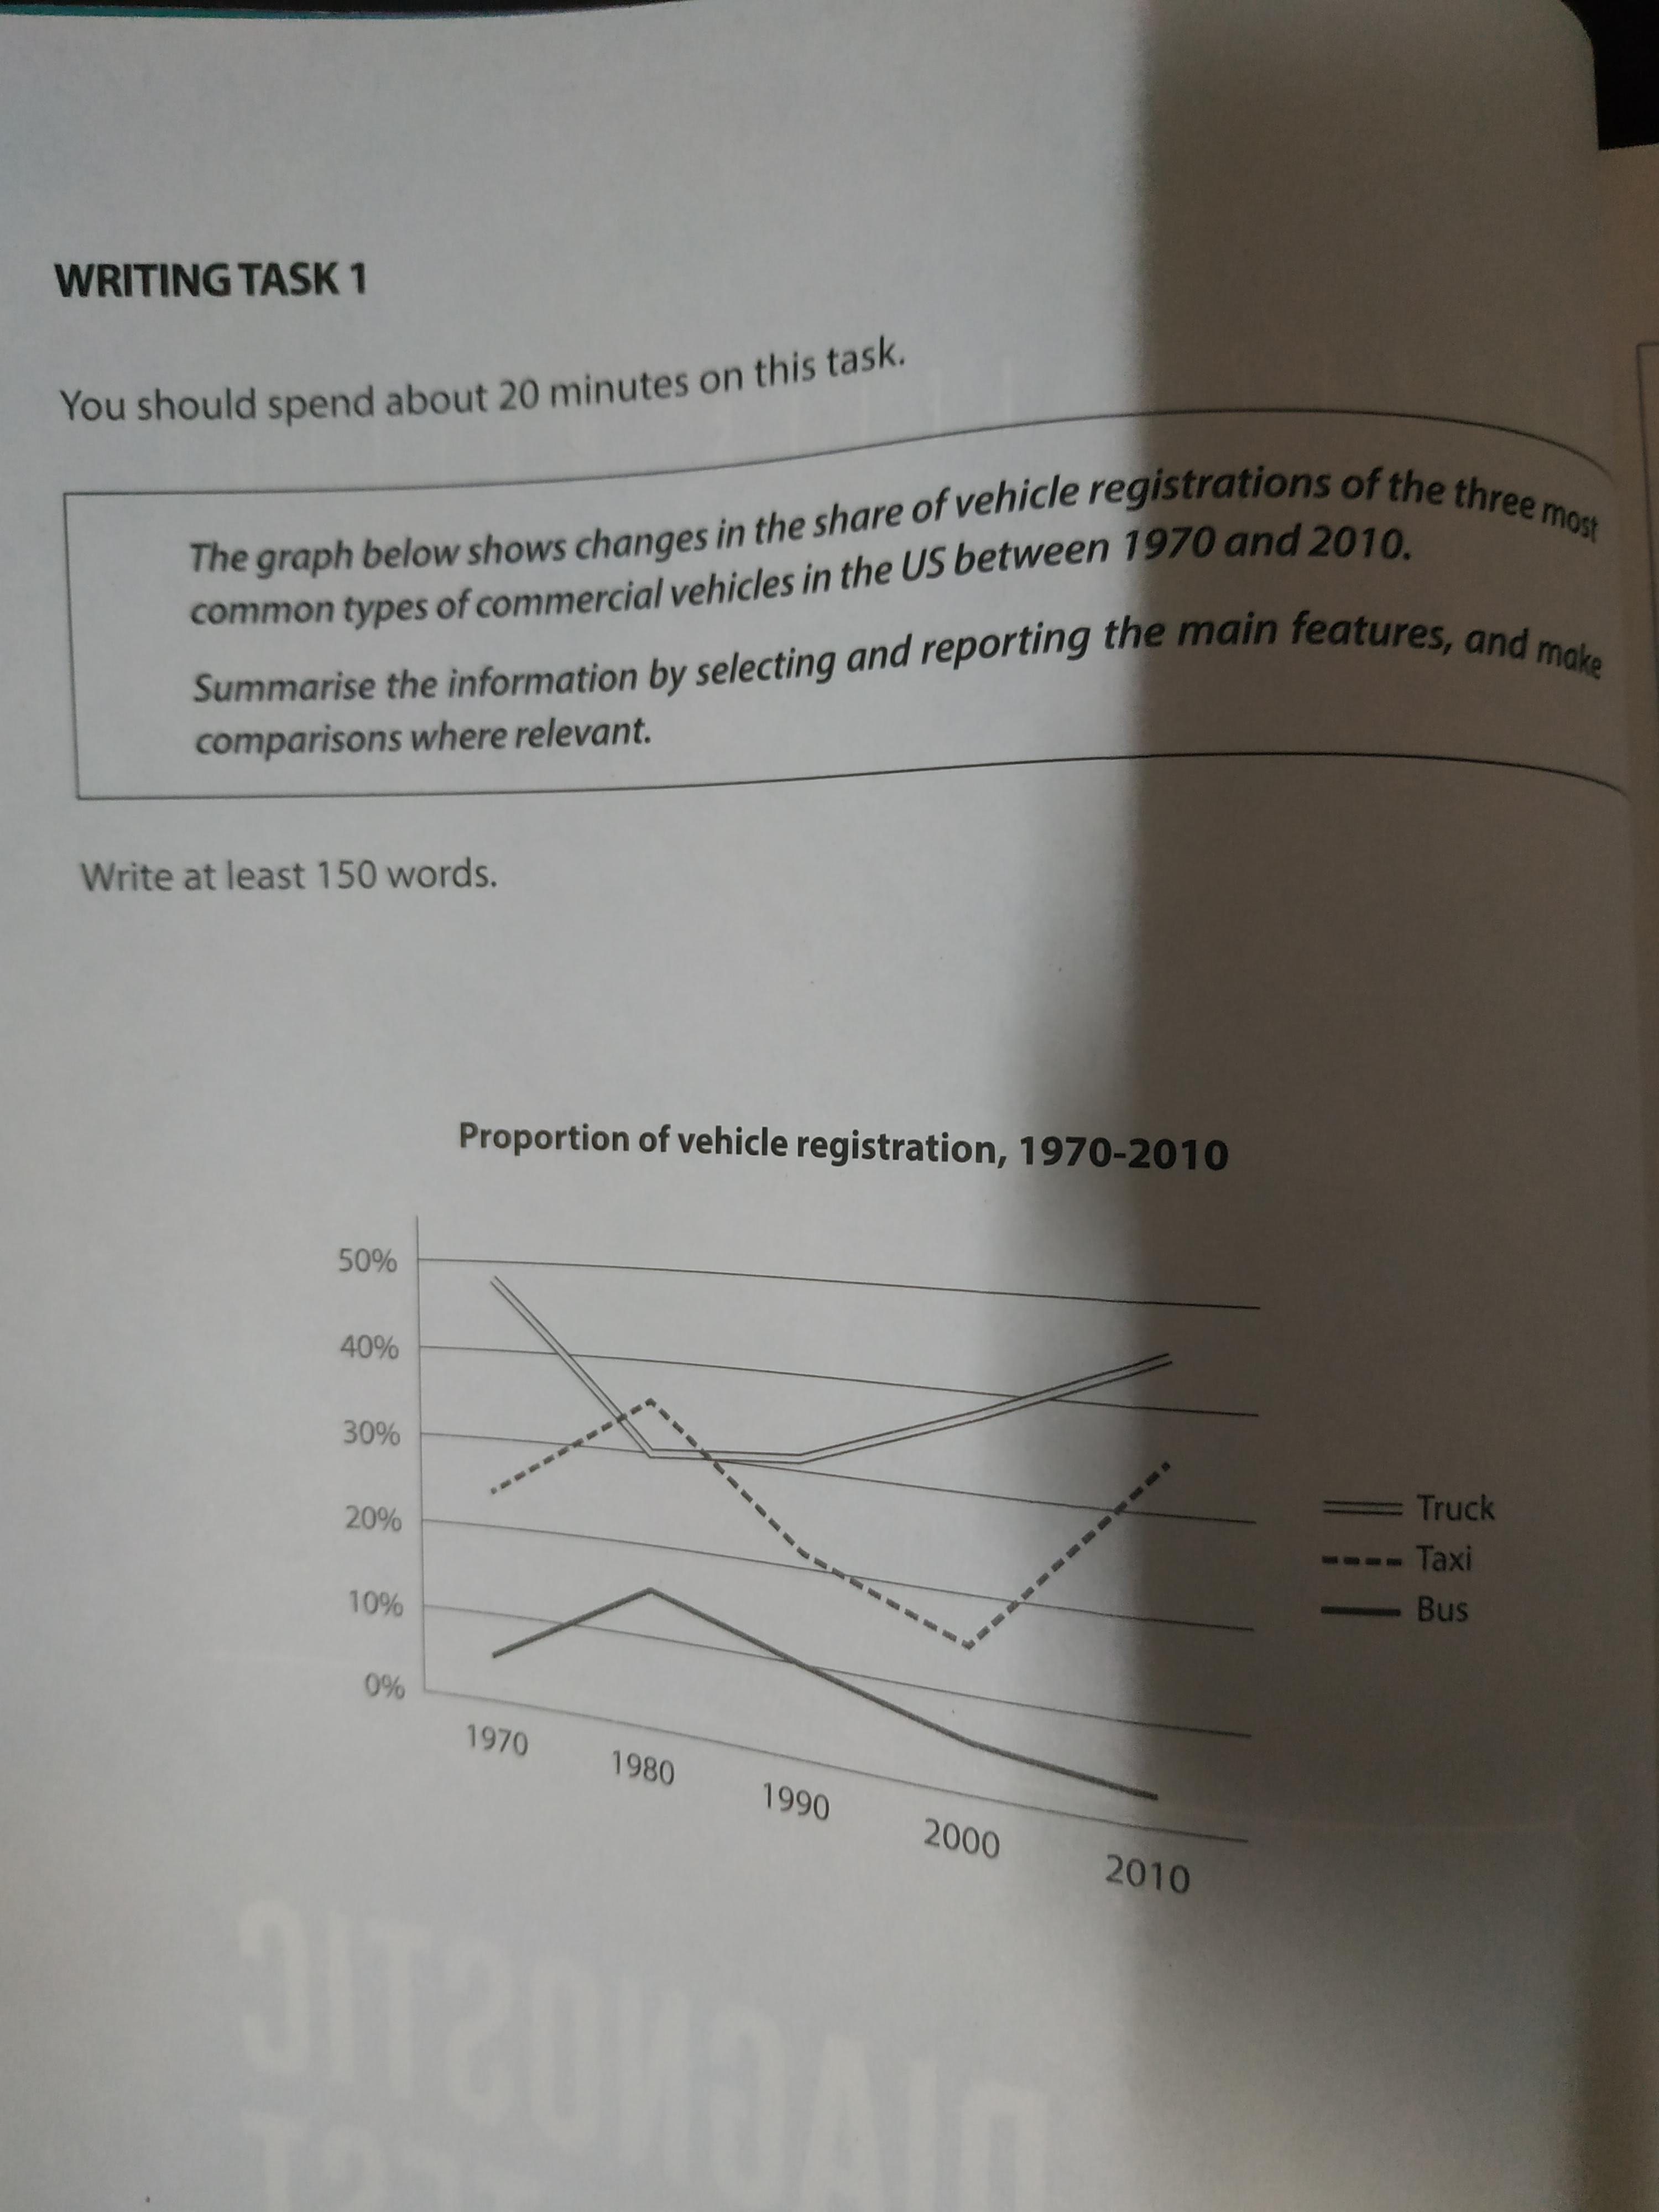
The line graph compares the proportion of the three most common types of commercial vehicles in US between 1970 and 2010.
(이 위치에 Overview를 넣어주셔야 합니다. In general~등의 표현을 시작하면서 표 전반의 내용을 1줄, 2줄 정도로 포괄해주시면 돼요. 만약에 이 밑의 문단을 Overview로 의도하신 거면, 저것보다 훨씬 간추리셔야 하며, )
It is clear that the truck is the most popular (수치가 높다고 그게 무조건 인기가 많은 게 아닙니다. 주의해주셔야 해요.) type of commercial vehicles in US. The proportion of using trucks stuck with was the highest except in 1980. The lowest figure on the chart are for the bus. The proportion of bus peaked at 15 per cent in 1980, before starting to fall falling steadily. It kept shows showing the lowest proportion from 1970 to 2010.
(제가 해드린 것처럼, 문단을 구분할 때에는 엔터키를 두 번 쳐주시면 됩니다.)
The proportion of using taxi was the second highest in 1970, but it overtook that of the truck and became the highest. The proportion of taxi gradually decreased from 1980 to 2000, so it returned to the second highest again after 1970, but this category also saw a dramatic increase from 2000 to 2010 by 15 per cent to 35 per cent.
In 2010, the truck achieved the highest proportion by 45 per cent. The taxi showed the second highest proportion by 35 per cent and the bus revealed the lowest in the figure by less than 5 per cent.
(180 words)
총평: (5/6/6/6) 6.0
지금 당장 시험 치르면 6.0받으실 확률이 높지만, 12월 5일까지는 꾸준히만 하시면 6.5 무조건 받으실 겁니다. 지금 0.5점이 부족한 건 요령 부족의 문제가 클 뿐이에요. 우선, task1에서는 Overview를 꼭 넣어주시고, 그 외에 반복되는 표현과 문장 구조에도 신경써주시면 되겠습니다.
수고하셨습니다 :)

 비밀번호 확인
 댓글 0개
댓글 0개


 불편사항 신고