


 인쇄
인쇄


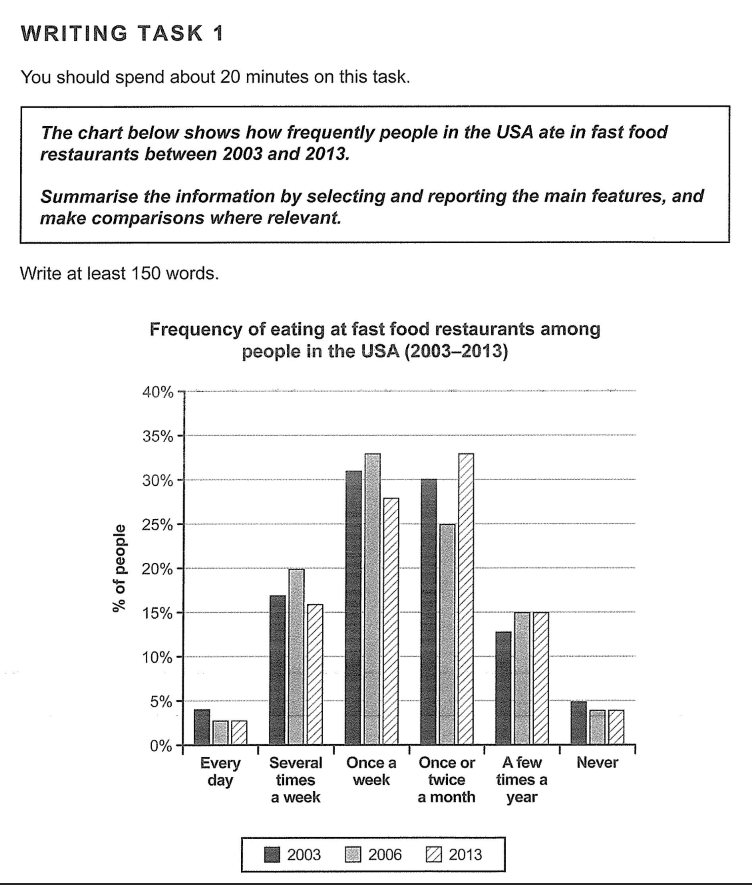
The bar chart illustrates how often people in the USA went to fast food restaurants from 2003 to 2013. As an overall trend, it is clearly apparent that people who ate in fast food establishments once a week and once or twice a month accounted for the highest percentages, whereas people who either never ate in these restaurants or went every day showed the lowest figures throughout the whole period.
In 2003 the number of individuals who ate in fast food restaurants once a week and once or twice a month accounted for around 30% both. For those in the once a week group, this figure increased slightly but then dropped to around 27% in 2013. The once or twice a month category declined to 25% then rose to approximately 33% by 2013.
In contrast, the figure for people who either ate at fast food restaurants every day or never stood at under 5% over an interval of ten years. The several time a week category accounted for 17% in 2003, rose in 2006, then settled back to around 16% in 2013. The few times a year group rose slightly and levelled off at 15% from 2006 to 2013.

 댓글 0개
댓글 0개


 불편사항 신고