


 인쇄
인쇄


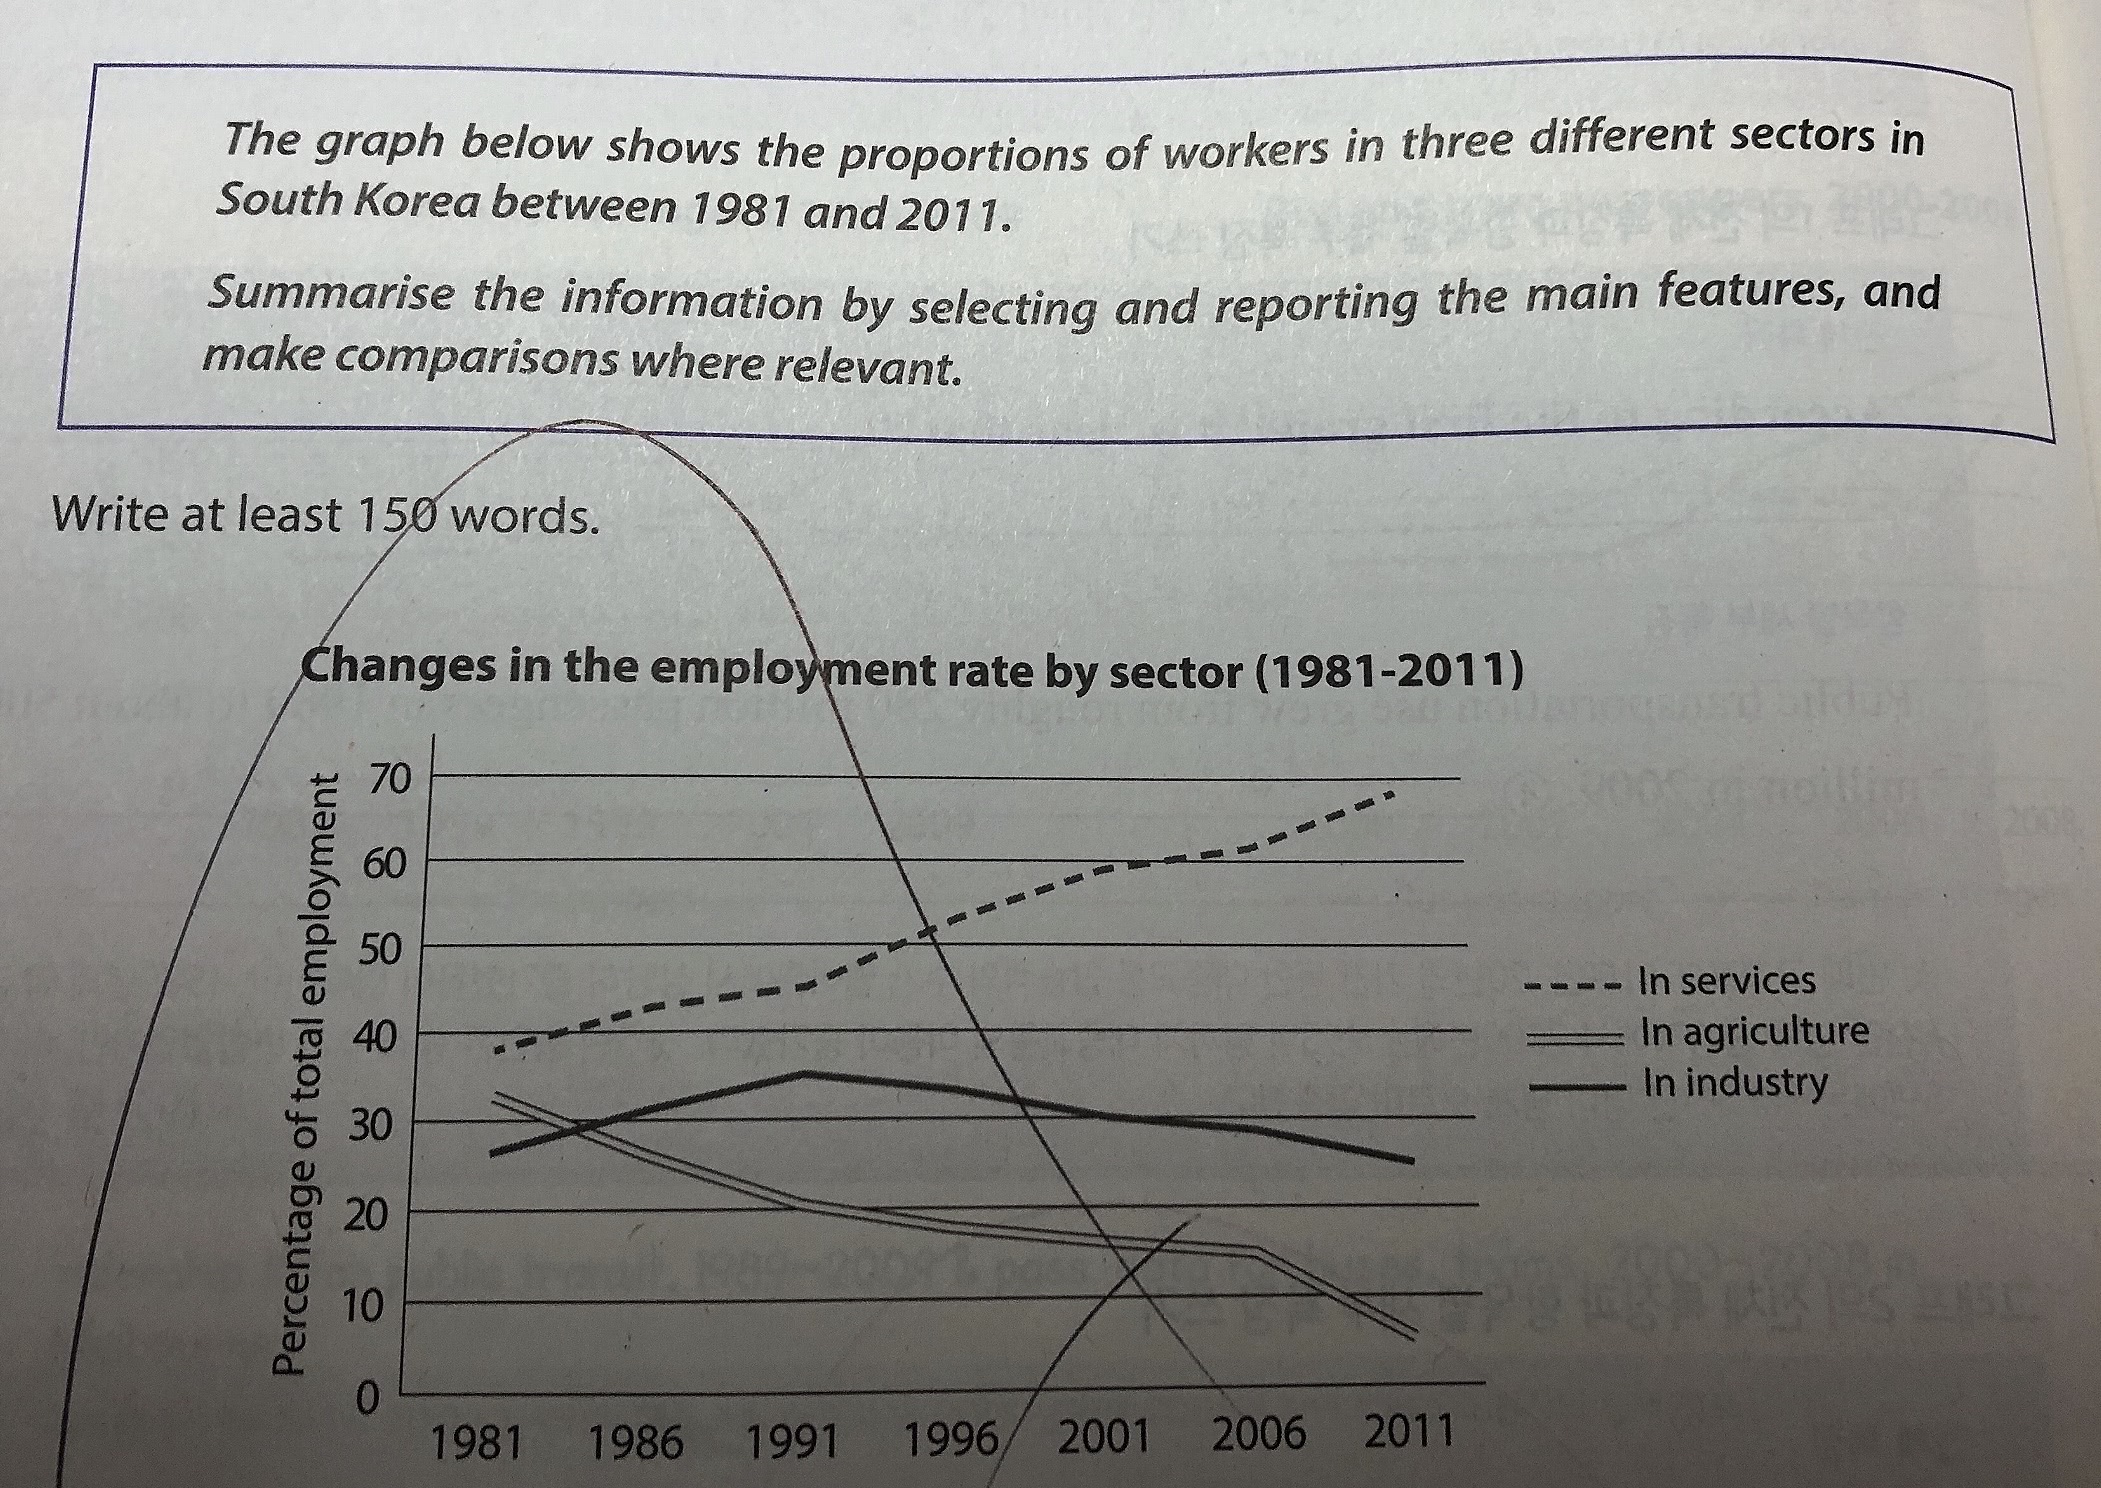
The given chart below indicates the proportions of workers in three different sectors in South Korea from 1991 to 2011. Overall, it is clear that the biggest changes have shown in service and agriculture over the given period and the proportion of workers in the industry fluctuated.
Looking at the graph more closely, we can see immediately that the rate of employees in services keeps stands out as the top over the given period. Moreover, it has significantly ascended from 1981 to 2011 and reached the highest point in 2011, recording 70 percent. On the other hand, the figure for the rate of workers in agriculture, the decreasing trend was seen over the 30 years. The rate of workers in agriculture has dropped notably from 33 percent in 1981 to 5 percent in 2011. Lastly, it is apparent that the proportion of employees who worked in the industry increased to over 30 percent between 1981 and 1991, however, the rate has declined steadily since 1991, dropping to roughly 25 percent in 2011.
소요시간: 24분
목표점수: 6.0
최대한 시간은 단축시킬려고하고있고 목표점수가 6.0이나 최저 컷트라인은 4.0이라서 조금은 편하게 공부할려고 하고있습니다!
설마 4.0이하로 점수가 나올 일은 없겠죠 선생님..??? 혹~시나 실전에서 실수해서 4.0밑으로 나올까 걱정이긴합니다 ㅎㅎ..

 댓글 0개
댓글 0개


 불편사항 신고