


 인쇄
인쇄


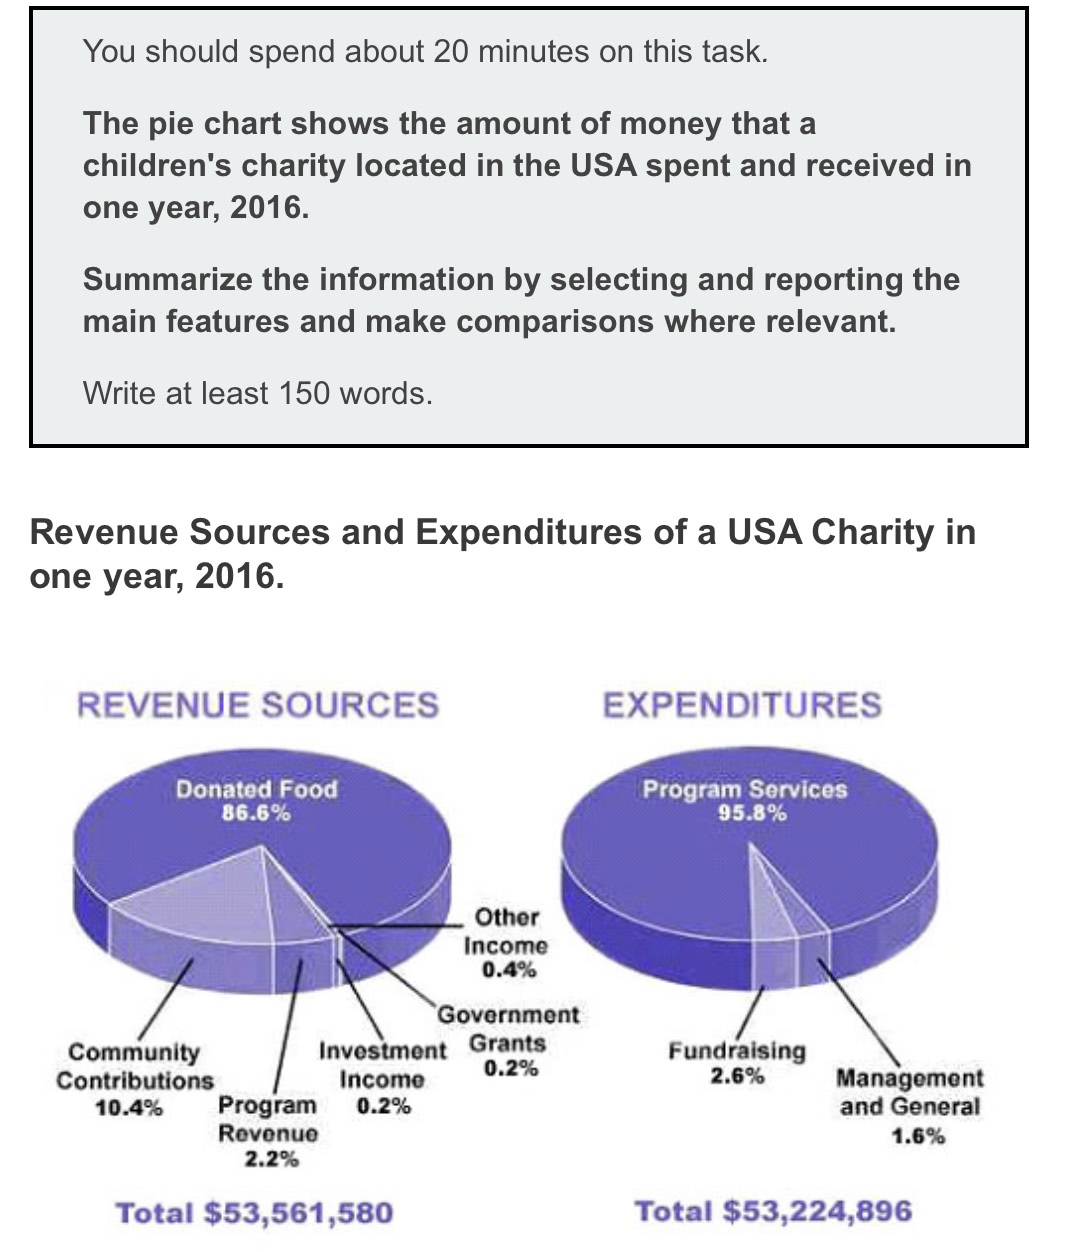
The pie charts compare propositions of a USA charity’s revenue sources and expenditures in 2016.
Overall, it is obvious that the spending of charity was around $340,000 less than the income in 2016. (두 표 모두 특정 항목에 있어 집중되는 모습을 보였다~라고 적어주시면 좋습니다.)
In terms of the source of the income, most of the revenue was originated from donated food which represented 86.6% of the total. The second largest source was contributed by the community, which took up approximately one-tenth of the revenue. It is followed by a the source of program revenue which constituted 2.2% of the total revenue. The other sources - investment income, government grants and other income – accounted for less than 1% in 2016.
With regard to expenditures, 95.8% of the revenue was spent on program services in 2016. The rest of the income was spent for the (안 들어가도 아예 틀린 건 아닙니다.) purposes of fundraising (2.6%) and management and general (1.6%).
총평: (8/7/8/7) 7.5
쉬운 표였던만큼 분석이나 표현 등에서 모두 크게 문제는 없었습니다. 관사만 살짝 고쳐드렸는데 이거야 뭐 어쩔 수 없는 영역이니까 너무 신경쓰지 않으셔도 되고요. 실전에서 이정도 쉬운 표가 나올 가능성이 낮긴 하지만, 그래도 기본적인 영어 실력은 좋으시니까 어떤 표가 나와도 크게 걱정은 없으실 거에요.
수고하셨습니다 :)

 비밀번호 확인
 댓글 0개
댓글 0개


 불편사항 신고