


 인쇄
인쇄


|
|
|||
|
<Topic> The
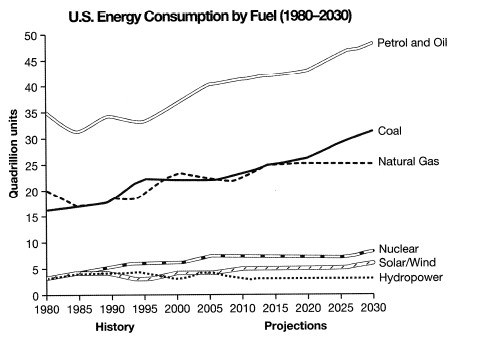
graph below gives information from a 2008 report about consumption of energy
in the USA since 1980 with projections until 2030.
|
|||
|
The supplied line chart delineates the 2008 report in
accordance with the consumption of different types of energy in the US from
1980 and 2030 in quadrillion units(hereafter Q).
Overall, most
of the energy types are expected to grow in 2030 with an exception, which is hydropower.
While natural resources show the high demand, eco-friendly energies seem the least
favorite (여기는 나름대로 중요한 사항인데, 숫자의 높낮음과 인기도를 자의적으로 연결시키기에는 조금 곤란합니다. 숫자가 낮은 이유는 단순히 인기가 없어서가 아니라 여러 현실적인 이유가 들어가있을 수 있기때문이죠. 물론 그렇다고 해서 대폭 감점이 있는 건 아니니까 그냥 참고로만 알아두세요~) choice throughout the given period. In regard to gasoline,
it has been the popular source of energy and also is forecast to maintain as
the highest demand compared to other energy sources. Initially, its consumption
started at 35Q and secured the same spending for twenty years despite a few fluctuations.
In the next 5 years, the graph steadily went up to 40Q and also expected to grow
by 10 to 50Q in 2030.
As to the
report of coal, although Americans spent 15Q in the beginning, it rose
In stark
contrast to natural resources, the usage of three green energies started nearly
one-seventh of gasoline’s demand and illustrate the sluggish growth. |
|||
|
[ 267 words] |
|||
|
Grammar |
Vocabulary |
Cohesion and Coherence |
Task Response |
|
8/9.0 |
8/9.0 |
7/9.0 |
7/9.0 |
task 1을 풀 때마다 효율적으로 줄이는 방법이 필요하다는 걸 느낍니다.
감사합니다.
총평: 맞습니다. task 1의 경우 상위권에서는 줄이기 싸움입니다. (물론 아이엘츠가 상대평가는 아니지만, 실질적으로는 상대평가의 성격을 갖고 있습니다.)
대신 이 줄이기는 모범답안을 참고해주시면 충분히 터득이 가능합니다. 모범답안이 모든 수험생에게 도움이 되는 건 아니고, 오히려 독이 되는 경우도 많지만 꽁치님께는 무조건 도움이 되니까 적극 활용해주세요!
+그리고 내용이 없어서 늘리는 걸 고민하는 것보다는 그래도 내용이 많아서 줄임에 대한 고민 하는 게 훨씬 나아요 :)
수고하셨습니다 :)

 비밀번호 확인
 댓글 0개
댓글 0개


 불편사항 신고