


 인쇄
인쇄


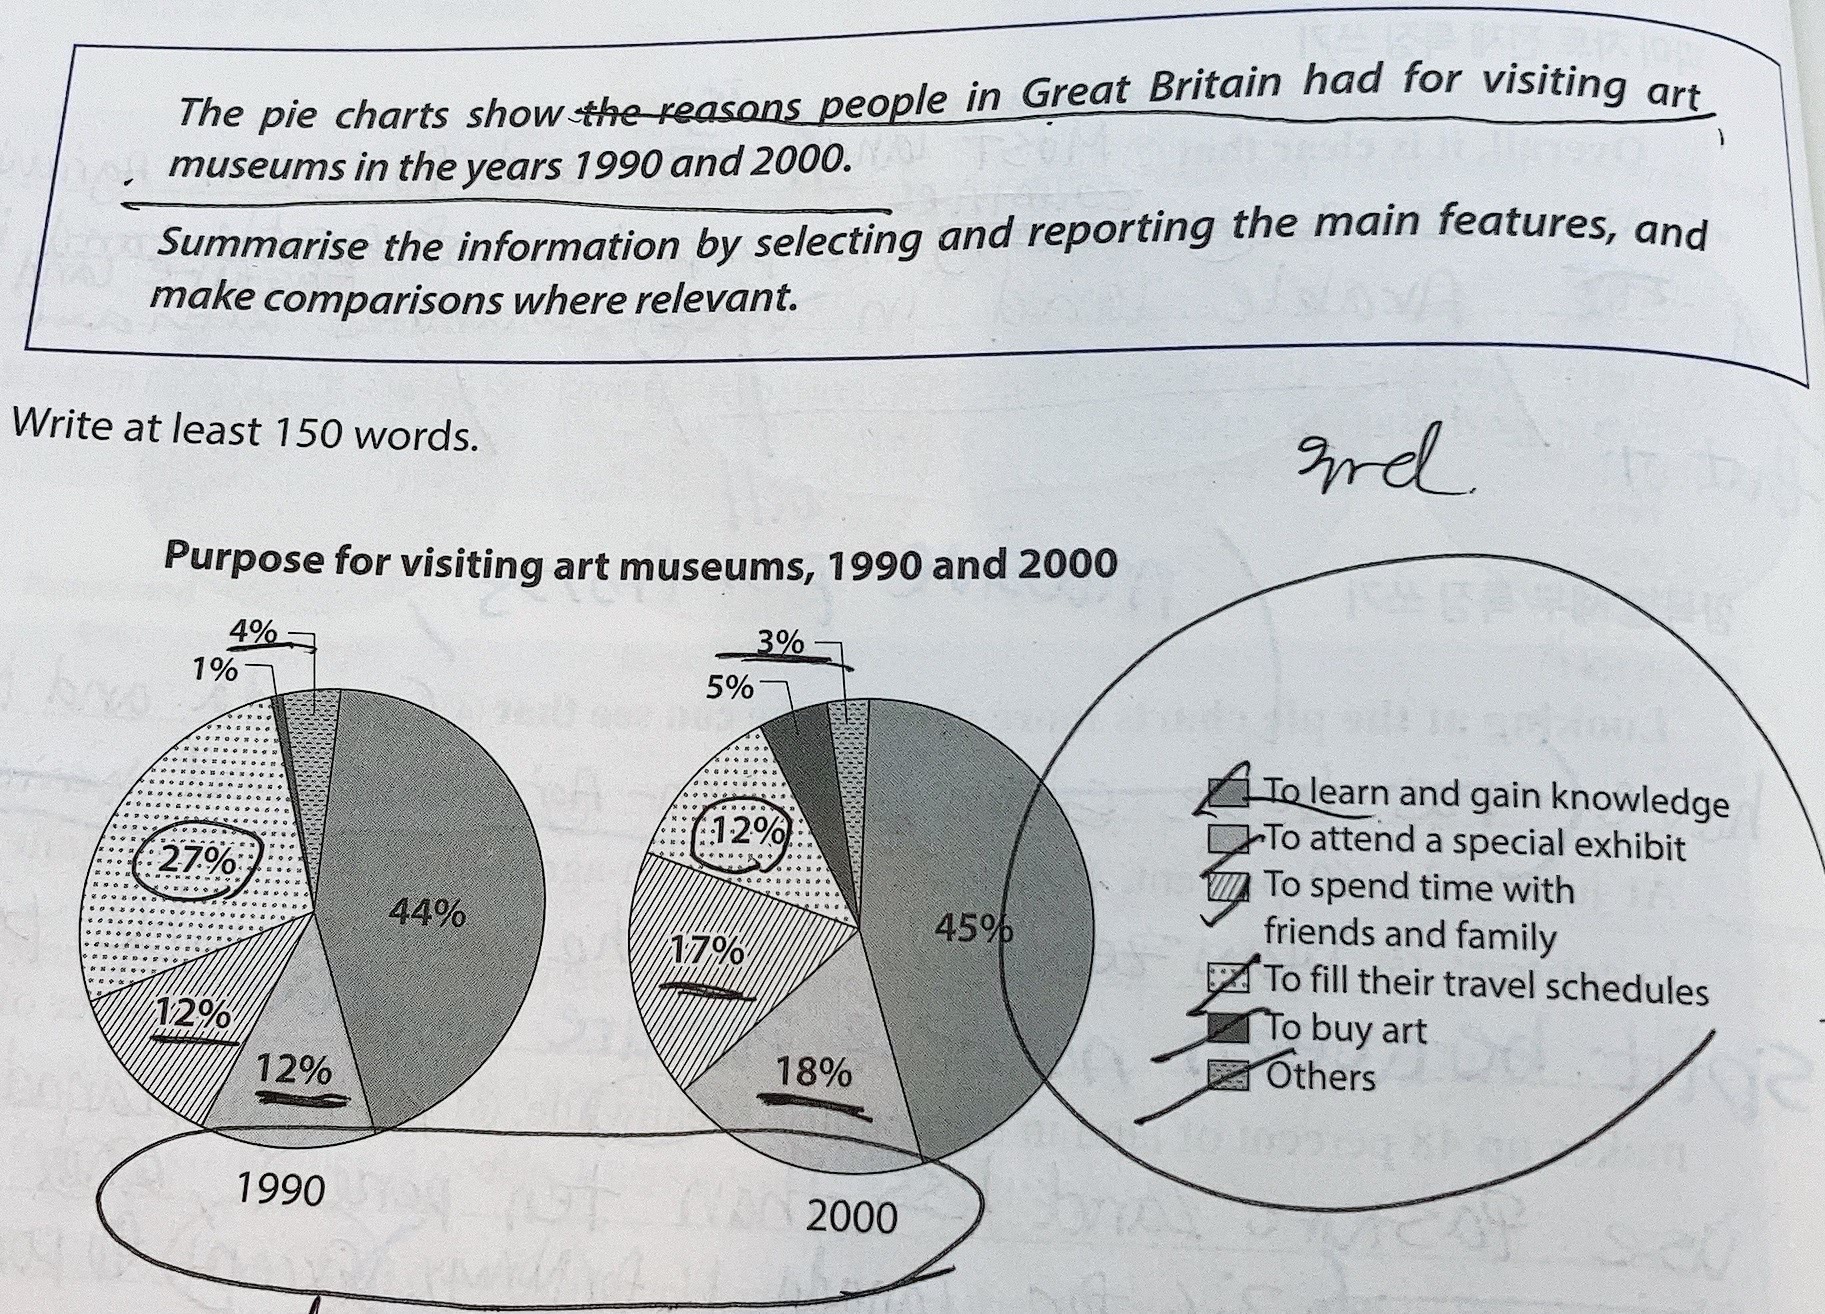
This given pie chart demonstrates that the purposes of visiting art museums in 1990 and 2000.
Overall, It is apparent that the purpose of learning and gaining knowledge occupied the largest proportion of both pie charts. The rest of the categories have fluctuated notably as well, exceptionally the segment of others made a meager discrepancy.
Looking at the graph more specifically, one can see that the proportion of the reason to learn and gain knowledge increased only a 1 percent point in 2000 compared to 1990. The proportion went up from 44 percent to 45 percent. However, the percentage of purpose for filling their schedule has considerably dropped by almost a half which means, it dropped from 27 percent to 12 percent. There are two categories that possessed the same rate with 12 percent in 1990. Those are the purposes to attend a special exhibit and to spend time with friends and family. Both went up by 5 percent point and 6 percent point respectively. Meanwhile, the segment of buying art was the smallest category in 1990 with 1 percent, it went up to 5 percent. Also, the proportion of the purpose to the others was one of the lowest in 1990 with 4 percent, but it dropped to 3 percent which became the smallest category in 2000.
215자 정도 하는것같습니당

 댓글 0개
댓글 0개


 불편사항 신고