


 인쇄
인쇄


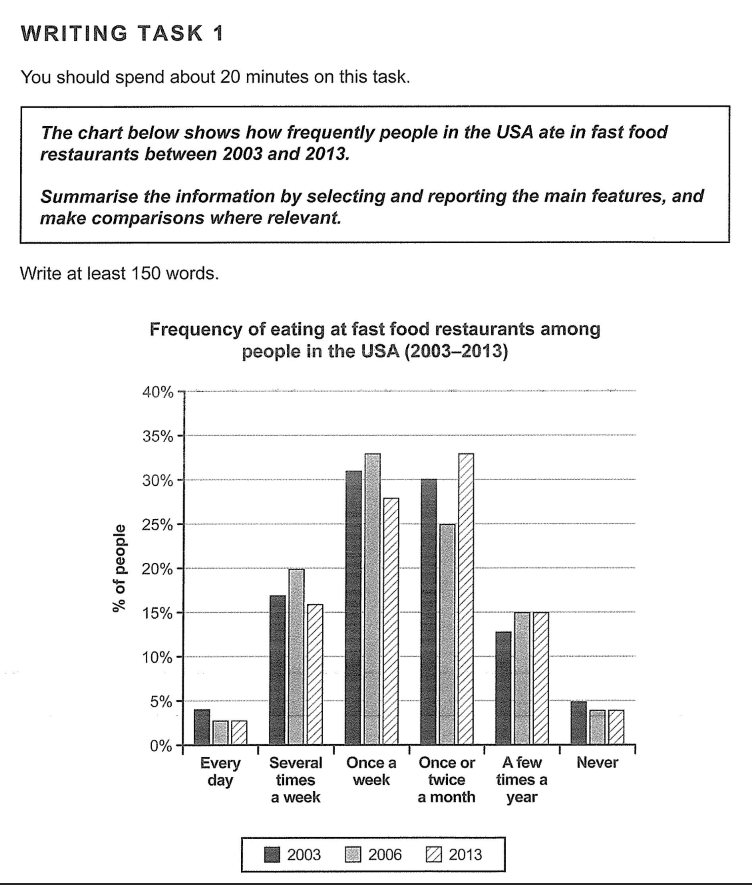
The bar chart illustrates how often people in the USA went to fast food restaurants from 2003 to 2013. As an overall trend, it is clearly apparent that people who ate in fast food establishments once a week and once or twice a month accounted for the highest percentages, whereas people who either never ate in these restaurants or went every day showed the lowest figures throughout the whole period.
In 2003, the rate number of individuals who ate in fast food restaurants once a week and once or twice a month both accounted for around 30% both. For those in the once a week group, this figure increased slightly but then dropped to around 27% in 2013. The once or twice a month category declined to 25% then rose to approximately 33% by 2013. (단순히 여기서 끝내기보다는, 03/06년도에 가장 높았던 항목과 13년에 가장 높은 항목 간 차이가 있기 때문에 이걸 다뤄주시는 것도 필요합니다.)
In contrast, the figure (너무 자주 쓰이는 단어이기 때문에 대체가 필요합니다.) for people who either ate at fast food restaurants every day or never stood at under 5% over an interval of ten years (좋습니다.). The several time a week category accounted for 17% in 2003, rose in 2006, then settled back to around 16% in 2013. The few times a year group rose slightly and levelled off at 15% from 2006 to 2013.
총평: (6/7/7/7) 7.0
패러프레이징이 그럭저럭 깔끔하게 됐다는 점 등을 고려했을 때 7점 정도까지는 괜찮을 거지만, 내용상으로는 약간의 아쉬움이 있었네요. 특히 제가 '단순히~' 로 말씀드린 부분은 꼭 반영해주세요!
수고하셨습니다 :)

 비밀번호 확인
 댓글 0개
댓글 0개


 불편사항 신고