


 인쇄
인쇄


목표: 5.5 이상
시간이 가는줄 모르고 안일하게 있다가, 시험이 당장 2주 뒤로 닥쳐서 급하게 벼락치기 중입니다. ㅠㅠ
5.5 이상은 꼭 받아야하는데 첨삭 및 채점 부탁드립니다! 감사합니다!!
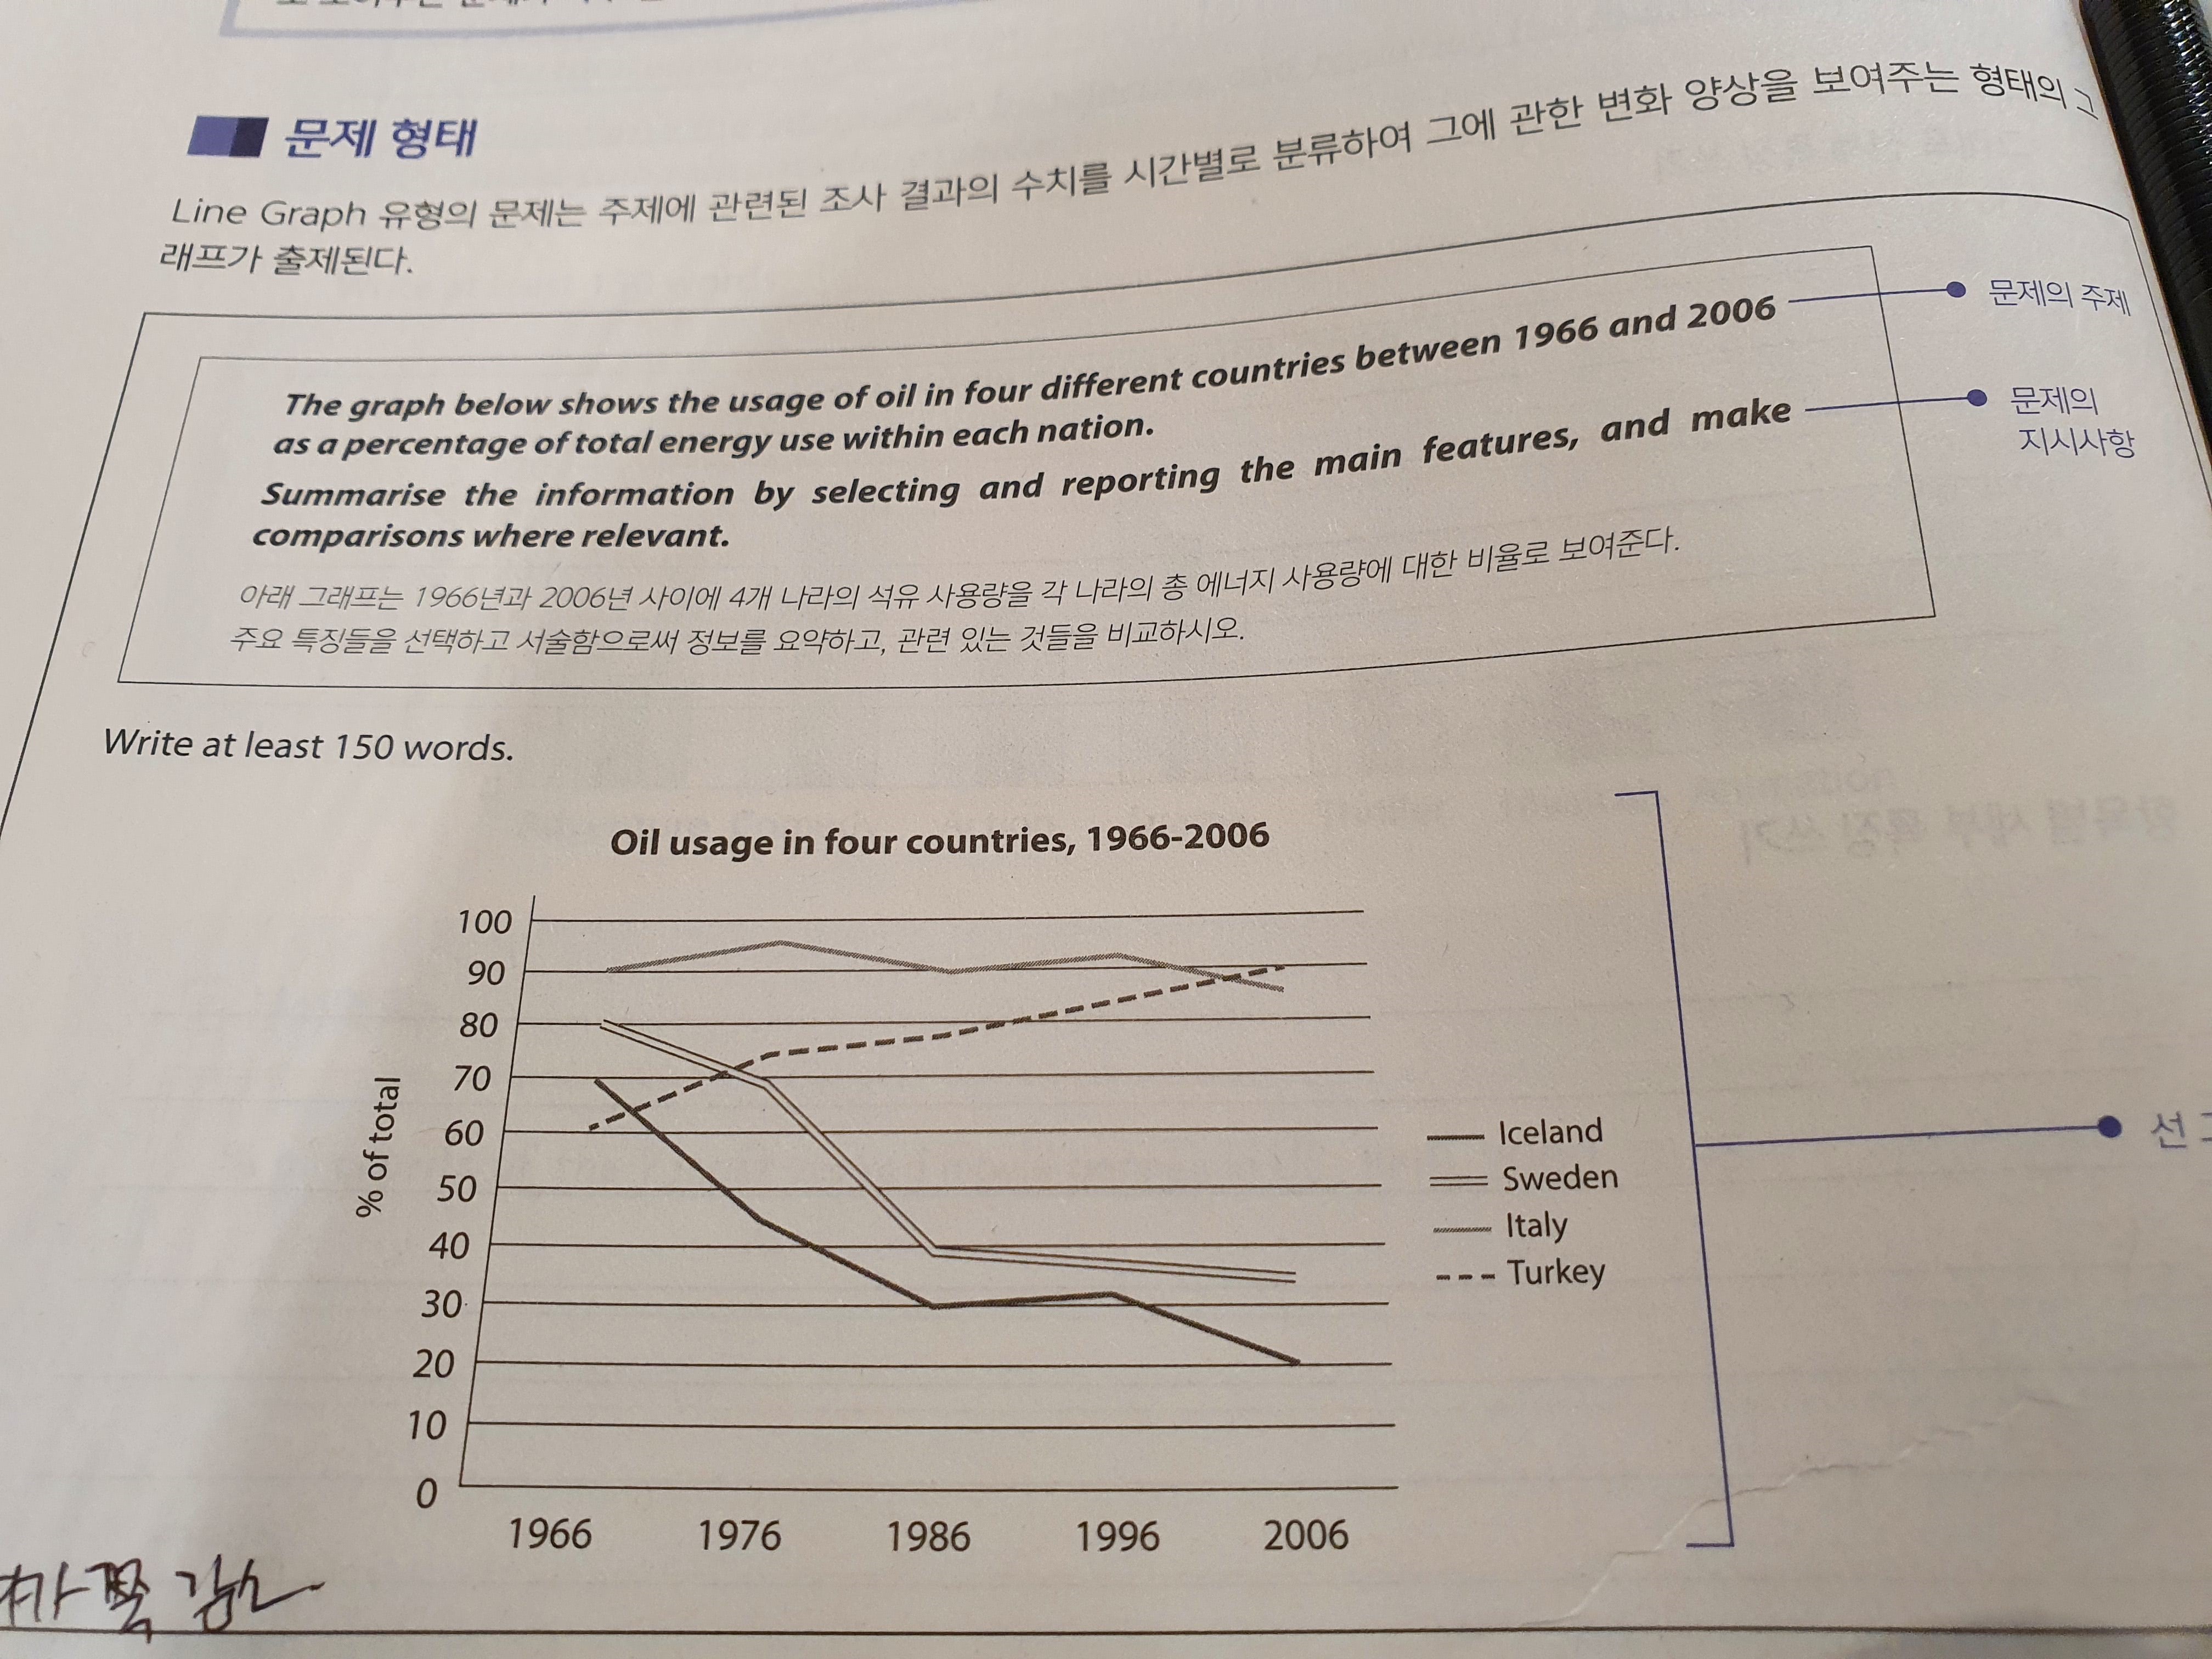
The
line graph gives information about the proportions of oil usage in four
different countries (Iceland, Sweden, Italy, and Turkey) from 1966 to 2006 as a
rate of each country’s total energy consumption.
Overall,
it is clear that the percentage of oil usage in Turkey increased significantly
over the period given. Meanwhile, the proportion of Italy was remained
relatively stable, while both Sweden and Iceland’s figure were dropped dramatically.
The
percentage of oil usage in Turkey started at around 60 percent in 1966 and then
continuously rose then reach nearly 90 percent which was the highest figure in
2006. In contrast, the rates of Sweden and Iceland began at 80 percent and 70
percent respectively. Both figures were almost halved by 1986 and then hit the
low in the last year.
The
percentage of Italy began at just over 90 percent in the first year and then slightly
fluctuated between about 85 percent and 95 percent. Italy had accounted for the
highest proportion of oil usage from 1966 to 1996, however, replace by Turkey
in the last year.
178단어 / 20분

 댓글 0개
댓글 0개


 불편사항 신고