


 인쇄
인쇄


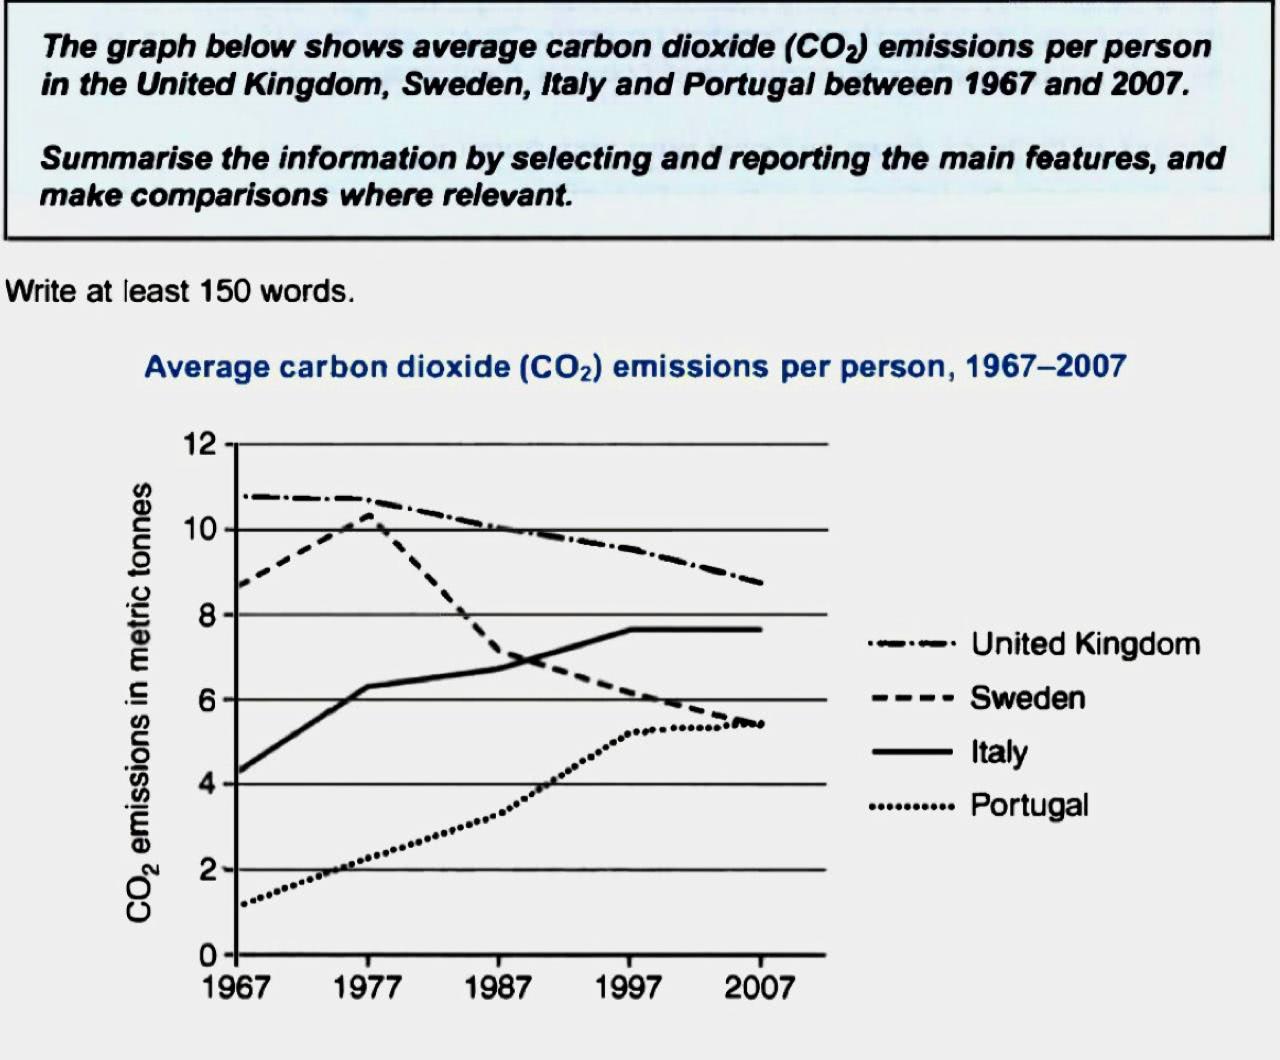
The line graph shows each person’s average carbon dioxide emissions in the United Kingdom, Sweden, Italy, and Portugal from 1967 to 2007.
Overall, it is clear that the United Kingdom and Sweden’s figure decreased gradually over the 40-year period. Meanwhile, the numbers of the average carbon dioxide emissions in Italy and Portugal surged.
Looking at the graph closely, one can see that the United Kingdom’s figure declined steadily between 1967 and 2007, but still has been the largest. That of Sweden had a small increase from 1967 to 2007 before dropping significantly to around 5tonnes 5 metric tonnes (다른데에도 싹 다 이렇게 바꿔주시면 됩니다.) in 2007, which showed the lowest rate of carbon dioxide emissions among the four countries. In contrast, the number of average carbon dioxide emissions in Italy almost doubled from 4tonnes in 1967 to 8tonnes in 2007. Portugal had the lowest figure of carbon dioxide emissions in 1967, being below 2tonnes. However, it soared remarkably by over 5tonnes by the end of the period in question. (이 문단의 경우 추가적으로 들어갈 사항들이 있습니다. 꺾은선 그래프에서는 수치 간 역전을 다루는 게 중요해요. 여기의 경우 포르투갈과 이탈리아의 수치들이 스웨덴의 숫자를 따라잡는 시점을 주요 분석 포인트로 잡아주시면 돼요.)
젠 선생님 인간만 계속 듣고 필사만 하다가 처음 써보았어요. 많이 부족하고 엉성한거 같아요ㅠㅠ
작성하는데 30분정도 걸렸고 단어 한두개정도 책 참고했습니다.
목표점수는 overall 6.5입니다
총평: (6/7/6/6) 6.5
처음 쓰신 것 치고는 되게 잘 해주셨습니다. 그러나 지금 당장은 6.5가 안 나올 겁니다. 시간 문제 등이 있고 해서요. 단, Overall 6.5 목표하시는 거니까 보통 라이팅은 6.0으로만 잡으셔도 충분하고, 6.0은 가볍게 받으실 거에요. 공부의 정도에 따라 추후에는 안정적인 6.5까지도 노려볼 수 있을 겁니다.
제일 중요한 건 시험 전까지 어떤 글을 쓰든 20분/40분 이내에 맞추는 것이 되겠습니다. 처음부터 10분을 확 줄이기는 불가능하지만, 그냥 2~3분씩 천천히 줄인다고 생각하시고 연습해보세요~
수고하셨습니다 :)

 비밀번호 확인
 댓글 1개
댓글 1개


 불편사항 신고