


 인쇄
인쇄


The pie charts below compare water usage in San Diego, California and the rest of the world.
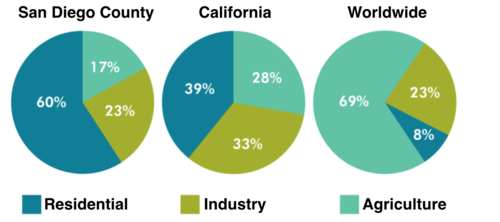
The three pie charts give information about water used in San Diego county, California and worldwide in order to purpose residential, industry and agriculture.
It is noticeable that people who live in the two different regions of America consumed mostly in home, however, in all of the world, agriculture accounts the most of the water used.
Looking at the graphs in detail, one can see that citizens of San Diego County and California used the water for residential, at 60% and 39%. By contrast, the proportion of water used in worldwide is only 8%. On the other hand, the purpose of agriculture is consumed the most world as a ahold, at 69%. However, the rate of water usage in San Diego County and California is just 17% and 28%.
When it comes to the water used for industry, there are not dramatic differences. In California, the used water is 33 per cent for industry. The percentage of water usage for industry is the same figure, at 23% in San Diego County and worldwide.
6.5 목표이구요
오늘은 25분걸려서 적었네요. 늘상 30 분 정도 걸리는데요 5분 단축했어요.
그런데 막상 쓰면서 헷갈린 부분이죠 시제는 없지만 사용한 것을 보아주니까 과거로 써야하나 고민이 되더라고요 ㅠㅠㅠ
Used 만 쓰고 다른건 그냥 현재형으로 작성했지만 헷갈리네요 ㅠㅠ
그리고 항상 감사합니다

 댓글 0개
댓글 0개


 불편사항 신고