


 인쇄
인쇄


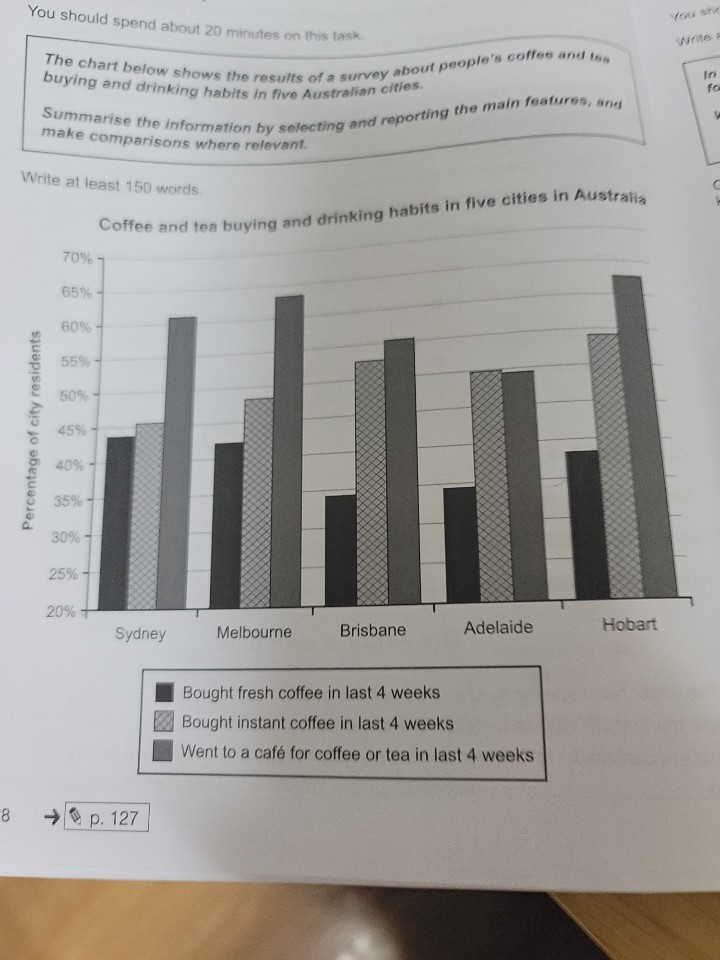
The given bar graph illustrates the information about percentage of city residents who have a coffee and tea buying and drinking habits in major cities in Australia.
It is clear that every proportions of bought fresh coffee in last 4 weeks are under 45 percent in given cities. In contrast, figures of went to a cafe for coffee or tea in last 4 weeks are almost 50 percent except one city, Adelaide.
In Sydney, people who bought two types of coffee are nearly equal, as 45%. And over 60 percent customers have used shops for take a cup of coffee or tea. Meanwhile, we can see another trend about having coffee through other graph. People who live in Adelaide have a trend that like a instant coffee rather than fresh one.
Melbourne, the capital of Australia, have a similar chart with Sydney. People used to a coffee shop are over 60 percent, nearly 65%, and part about bought fresh coffee has the lowest graph among three graph.
1. 목표점수 : 6.5
2. 다음시험 : 10월 11일 예정
3. 시간 : 20분

 댓글 0개
댓글 0개


 불편사항 신고