


 인쇄
인쇄


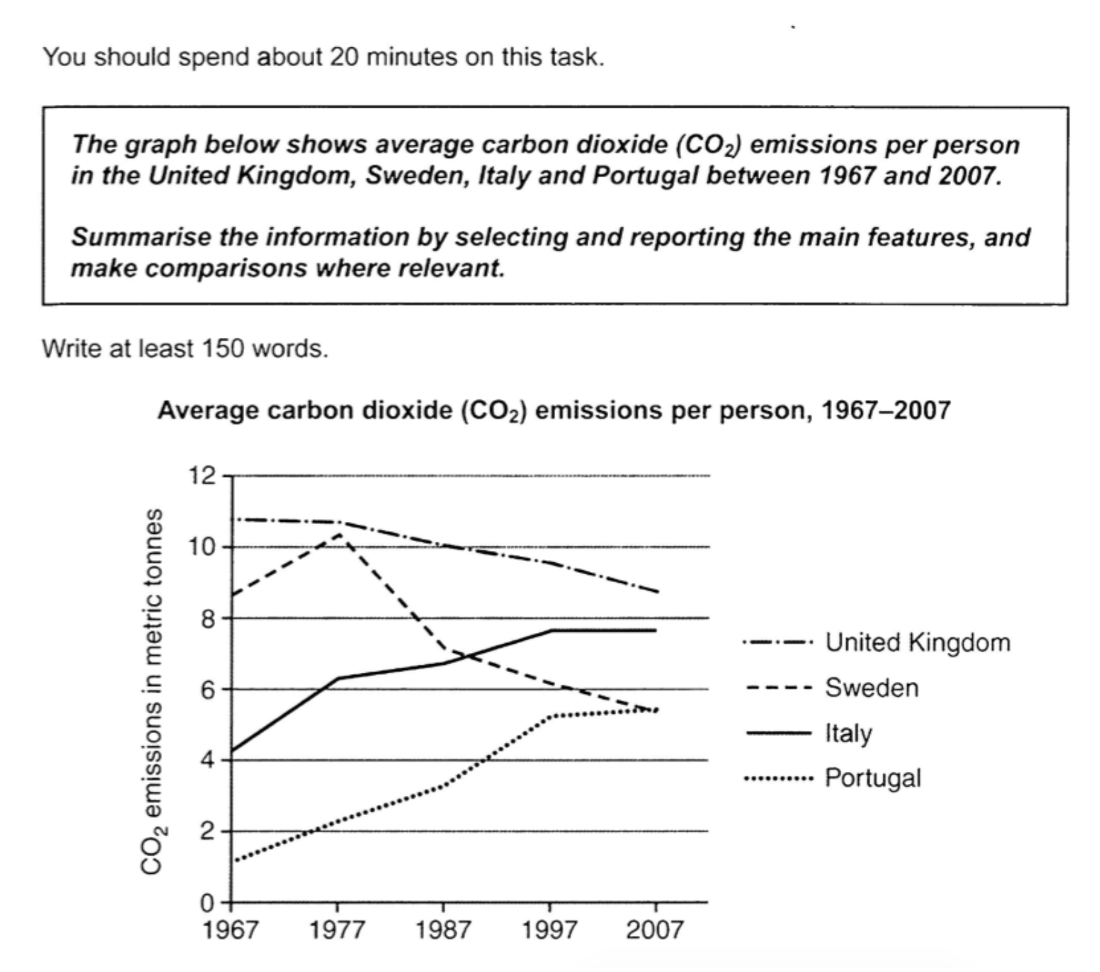
The line graph provides information related to the amount of average carbon dioxide emissions that a single person made during the years 1979 to 2007, with focus on four different countries, which include United Kingdom, Sweden, Italy and Portugal.
In general, it can clearly be seen that there were steady increases in two out of four nations and the figure of carbon dioxide gradaully dropped in the two rest locations.
Initially, the United Kingdom illustrated the highest consumtion of carbon dioxide per person, accounted for approximately 11 tonnes in 1967, this then gradually decreased to just over 8 tonnes by 2007. Regarding made emissions by people in Sweden started from just over 8 tonnes and this number showed a peak at about 10 tonnes in 1977, then dropping to nearly 5 tonnes in 2007.
Meanwhile, the lowest carbon dioxide accounted for about 1 tonnes in Portugal while average Italians emitted about 4 tonnes in the year 1967. However, those figures tallied gradual increases by 2007, in just under 6 and 8 tonnes, respectively.

 댓글 0개
댓글 0개


 불편사항 신고