


 인쇄
인쇄


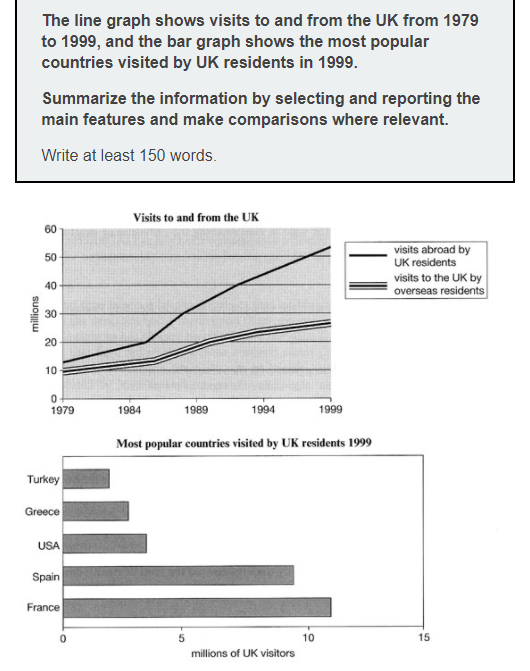
The graphs illustrate the number of visits from and to the UK from 1979 to 1999, at five-year intervals, (이렇게 표가 두 개 있는 경우에는, 쉼표도 표 단위로 끊어주셔야 합니다.) and the most popular countries that British people visited in 1999.
Overall, it is clear that the figures of the UK residents who traveled abroad and visitors to the UK increased over the period shown, with the former figure showing the larger rate of growth. Also evident is that the UK residents visited France and Spain the most, compared to the other countries.
Between 1979 and 1999, the statistics of visits abroad by British people dramatically went up from above 10 million in 1979 and well over 50 million in 1999. Similarly, overseas residents who visited the UK rose to slightly under 30 million by the end of 1999. Notably, the gap between two graphs had widened after 1979.
With regards to the bar chart, the UK residents
visited France the most, with more than 10 million visitors, followed by Spain,
which showed just below 10 million visitors. Meanwhile, it is noticeable that the statistics
of the US, Greece, and Turkey, were by far the least visited countries,
accounting for less than 5 million visitors in average respectively.
목표점수 7.0, 걸린시간 22분 감사합니다!
총평: (7/7/7/7) 7.0
크게 문제가 있는 건 아니었지만, 맨 마지막에 the statistics~부분의 경우 센님 실력이면 당연히 맞춰주셔야 합니다. 한국어로 바꿔보시면 뭐가 문제인지 금방 파악하실 건데, 저런 거에만 조금 주의해주세요!
수고하셨습니다 :)

 비밀번호 확인
 댓글 0개
댓글 0개


 불편사항 신고