


 인쇄
인쇄


감사합니다.
The
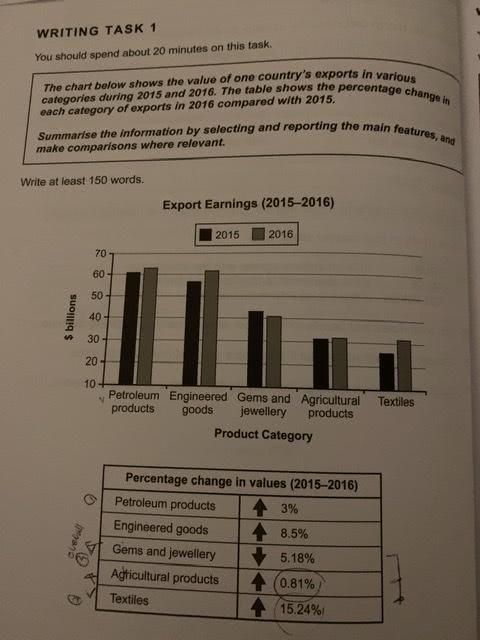
bar chart illustrates an unmentioned country’s export income from diverse products in 2015 and
in 2016, and units are measured in billion dollars, while the table illustrate
the proportion change in each group of exported products in 2016 in comparison
to 2015. Overall, there is a profound difference between the highest and
the lowest income. In addition, export-income from all given
products increase in 2016 excepting gems and jewellery.
Turning first to the detail, petroleum products achieved the highest export income in both given years, increasing 3% in 2016. Secondly, increase percentage of textiles export is the most (15.24%) but its value is the lowest, recording 25 billion dollars and 31 billion dollars respectively.
On the other hand, Agricultural products
has the lowest increase percentage (only 0.81%) excepting gem and jewellery’s
decrease percentage by 5.18%. Meanwhile, value of engineering goods was about
59 billion dollars in 2015, increasing by 8.5% in 2016.

 댓글 0개
댓글 0개


 불편사항 신고