


 인쇄
인쇄


감사합니다.
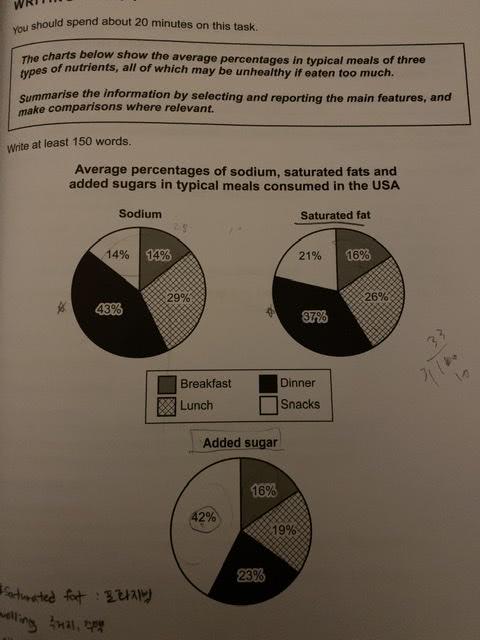
The pie charts illustrate the average proportion of three nutrients, which can
be unhealthy if consumed too much, in daily meals (breakfast, lunch, dinner and
snacks). The given three nutrients include sodium, saturated fat and
added sugar and the data is taken from the United States of America (시간이 부족했다면 이 문장은 1순위 삭제 대상입니다. 지금도 굳이 이렇게 나열할 필요 없고, 그냥 USA만 살짝 앞 문장으로 같이 넣어주시면 돼요.). Overall,
both sodium and saturated fat have similar tendency of proportion whereas added sugar has considerable
differences. However, in all three types of nutrients,
proportion of breakfast occupys the least.
Turning first to the details, both in
sodium and saturated fat, proportion of dinner accounts for over one third of the total, occupying
43% and 37% respectively. On the other hand, in added sugar,
proportion of snack occupies almost half (42%).
With regards of remaining meals,
percentage of lunch take second place in both sodium (29%) and saturated fat
(26%). In addition, sodium is consumed as in the same proportion for breakfast
and snack, while the percentage of snack is 5% (지금은 수학시간이 아니니까 굳이 뺄셈을 하실 필요는 없습니다만, 나는 굳이 빼야겠다 싶으면 퍼센트포인트를 붙여주시면 돼요. 이에 대해서는 링크를 드리겠습니다.) higher than that of breakfast in saturated
fat. Lastly, in added sugar, percentage of remaining three meals except snacks are
relatively even.
총평: (7/7/6/7) 7.0
task1에서 제일 덜 중요한 문단은 서론, 즉 지금 글의 경우는 첫 두 문장입니다. 여기서 항목을 일일히 나열하거나 불필요한 내용을 길게 쓰면서 시간을 낭비하지 말고, 최대한 빠르게 Overview와 세부적인 분석에 집중해주세요!
퍼센트포인트의 경우 밑의 링크를 참고해주시면 되겠습니다.
수고하셨습니다 :)
https://www.gohackers.com/?c=ielts/ielts_info2/ielts_method&type=url&uid=486596

 비밀번호 확인
 댓글 0개
댓글 0개


 불편사항 신고