


 인쇄
인쇄


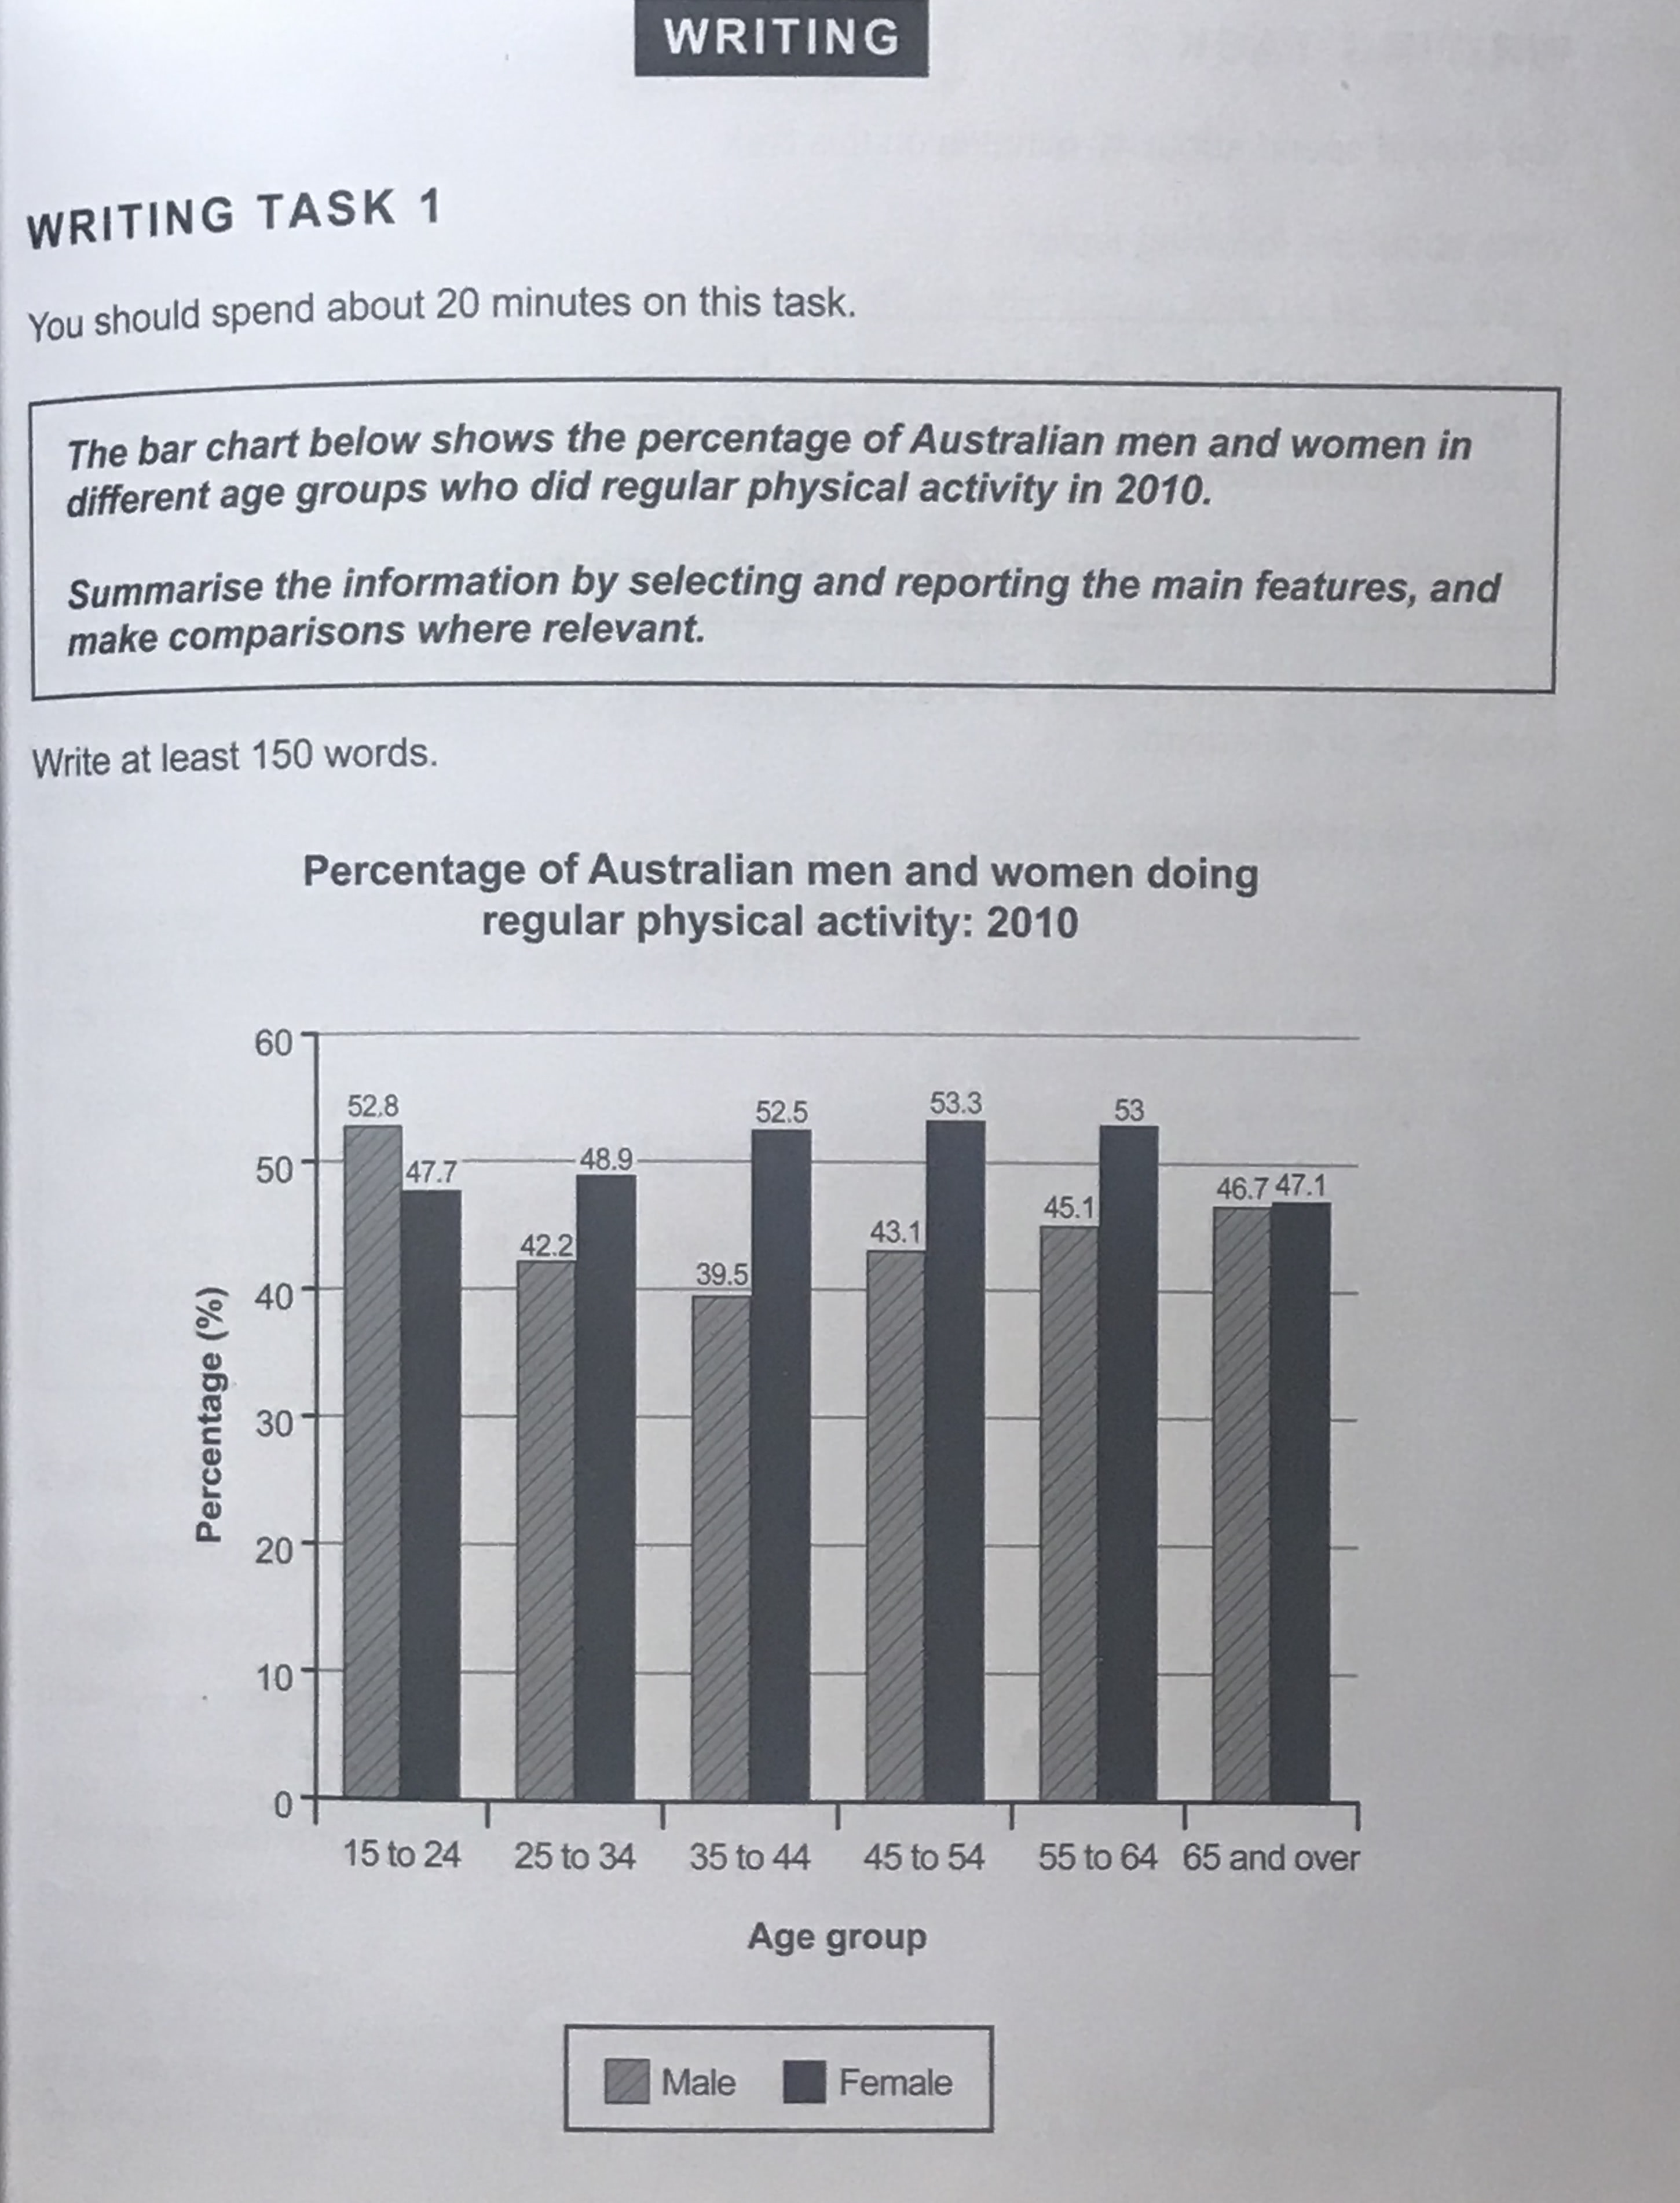
The bar chart indicates that the figure of Australian men and women in different age groups doing regular physical activities in 2010.
Overall, it is clear that the most of female were more doing activities than men except for the group of 15-24 year olds.
Looking at the bar chart more closely, one can see that people from 45 to 54 years old of women showed the highest percentage, which was 53.3 percent, while 39.5 percent of the men group of 35-44 year olds was the lowest in all the age groups. And also, this group had the biggest gap between women and men. Interestingly, 65 and over age of group were almost equal to men and women, which were 46.7 and 47.1 percent, respectively.
Furthermore, the proportion of women had increased gradually from 15-24 year olds to 45-54 year olds, but and then fall slightly. In the group of men, there was deceasing the figure to people from 35 to 44 years old. However, eventually the number rose to 46.7%.
To sum up, both of groups had fluctuated as each different groups in 2010.
소요시간 : 22분
글자수 : 185
목표점수 : 6.5-7.0
스스로 처음 써보는 글입니다!
첨삭 부탁드립니다 :)

 댓글 0개
댓글 0개


 불편사항 신고