


 인쇄
인쇄


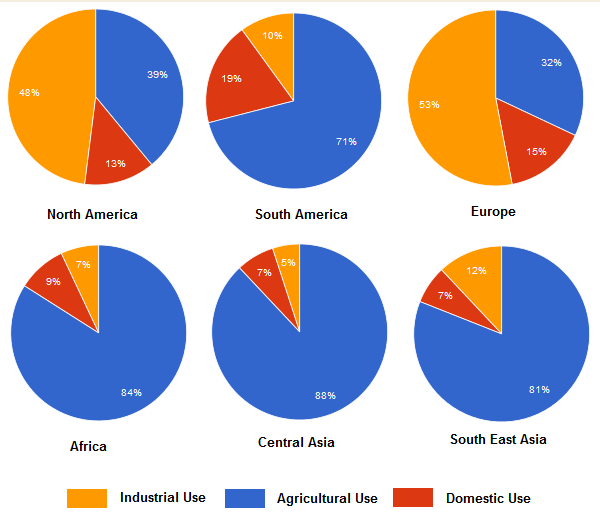
The pie graph demonstrates percentages of industrial, agricultural and domestic water use in North America, South America, Europe, Africa, Central Asia and South East Asia. (이렇게 항목을 나열하면서 분량을 때우는 게 아니라, 실질적인 분석으로 채워주셔야 합니다. 예를 들면 대륙들은 그냥 six different~로 가시면 되며, 앞의 3개 항목 역시 마찬가지에요.)
In general, agricultural use of water takes the largest most large part of the graph for all 6 continents and domestic use of water shows
a smallest part for all. (다 그렇지 않습니다. 이는 앞의 agricultural use 역시 마찬가지에요.) However, every continent has different rate of industrial
use of water. In case of Central Asia, there is a small fraction of the total
for industrial use.
What stands is that industrial use of water
in North America and Europe is close to a half of the total. Compared Comparing to Africa,
Central Asia and South East Asia, domestic use of water in North America, South
America and Europe is above 10 percent.
---------------------------------------------------------
목표 : 7.0
걸린시간 : 17분
첫번째 문단에 percentages of 라고 써도 되는지요..? -> 됩니다!
대륙들 이름으로 글자수를 채운 것 같아서 염려되네요.. -> 안 좋습니다.
오늘도 감사합니다.
좋은 하루 되세요.
mmjjR님도 좋은 하루 보내세요!
총평: (5/6/6/6) 6.0
mmjjR님은 task2는 그럭저럭 괜찮게 적어주시는데, task1의 경우는 아직 많은 발전이 필요합니다. 참고로 이 글은 분량조차 부족한 상황이라(120자 언저리밖에 되어보이지 않네요.) 사실상 5점대로 보셔야 합니다.
이 글은 시간 재지 말고 다시 쓰시되, 1. 서론에서 항목 나열하는 식으로 분량 때우지 마시고 2. 구조를 다시 잡아서 쓰시면 됩니다.
이때의 구조는 서론-Overview-북미&유럽의 공통/차이점-나머지 4대륙의 공통/차이점의 4개 문단으로 쓰시면 돼요. 다시 써서 검사받으세요!
수고하셨습니다 :)

 비밀번호 확인
 댓글 0개
댓글 0개


 불편사항 신고