


 인쇄
인쇄


|
|
|||
|
<Topic> The
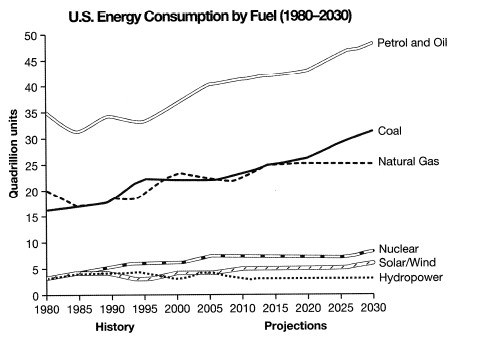
graph below gives information from a 2008 report about consumption of energy
in the USA since 1980 with projections until 2030.
|
|||
|
The supplied line chart delineates the 2008 report in
accordance with the consumption of different types of energy in the US from
1980 and 2030 in quadrillion units(hereafter Q).
Overall, most
of the energy types are expected to grow in 2030 with an exception, which is hydropower.
While natural resources show the high demand, eco-friendly energies seem the least
favorite choice throughout the given period. In regard to gasoline,
it has been the popular source of energy and also is forecast to maintain as
the highest demand compared to other energy sources. Initially, its consumption
started 35Q and secured the same spending for twenty years despite a few fluctuations.
In the next 5 years, the graph steadily went up to 40Q and also expected to grow
by 10 to 50Q in 2030.
As to the
report of coal, although American spent 15Q in the beginning, rising to 20Q in
1995. No dramatical soaring is not observed, however, its demand is estimated
to go up almost doubled than the initial. Spending of natural gas seems to have
a similar trend with that of coal after it started with 20Q, but it is predicted
to maintain about 25Q from 2015 to the end.
In stark
contrast to natural resources, the usage of three green energies started nearly
one-seventh of gasoline’s demand and illustrate the sluggish growth. while nuclear
has been used and is expected to be consumed slightly more than 5Q in the end
which is closely trailed by that of solar/winds, hydropower is foreseen to be
the most peripheral energy source with half less than 5Q. |
|||
|
[ 267 words] |
|||
|
Grammar |
Vocabulary |
Cohesion and Coherence |
Task Response |
|
/9.0 |
/9.0 |
/9.0 |
/9.0 |
task 1을 풀 때마다 효율적으로 줄이는 방법이 필요하다는 걸 느낍니다.
감사합니다.

 댓글 0개
댓글 0개


 불편사항 신고