Your Answer ▼
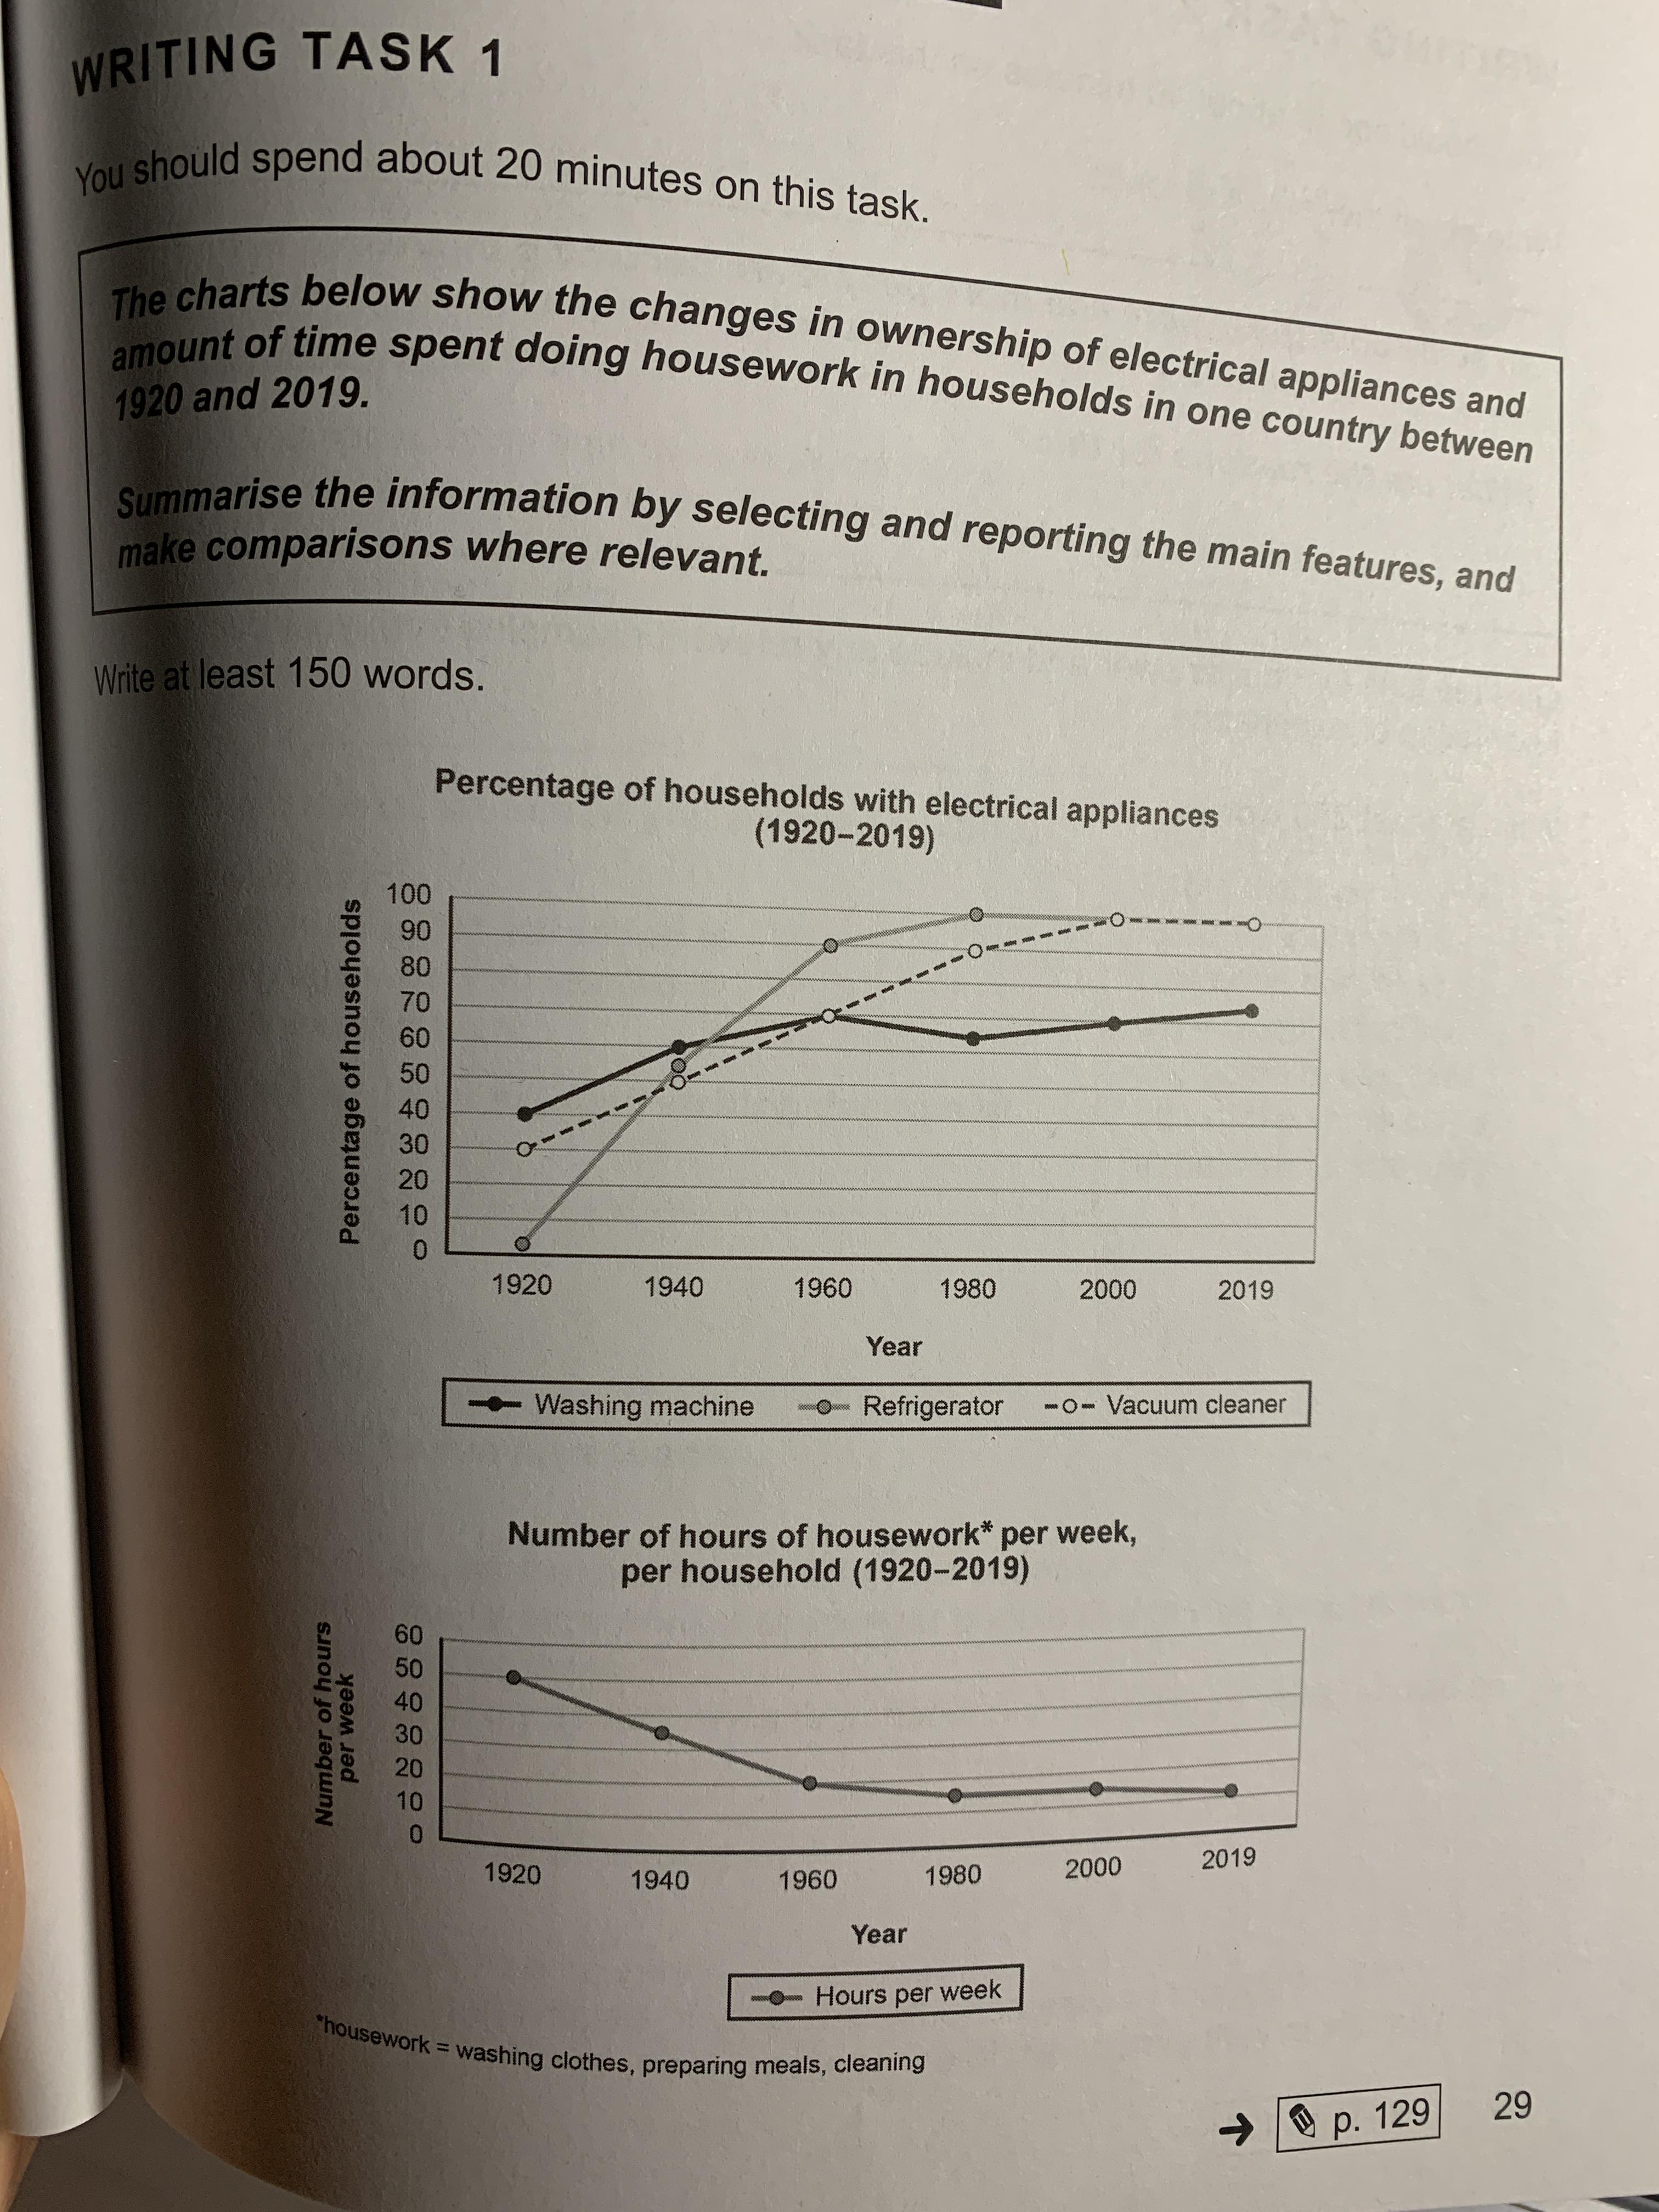
The first line graph shows the ownership percentage of electrical utensils’ percentage ownership of households, and the second one indicates changing the time the changed time of housework per week, per household between 1920 and 2019.
According to the first graph, it is clear that the percentage of households with electrical appliances in the country almost increased over 100-year period.
the percentage of washing machine and the refrigerator increased sharply (grew from roughly) between 1920 and 1960, and the refrigerator reaches tthe reached the highest point of 100% in 1980, which is early than vacuum cleaner that peaked at same percent in 2000. However, washing machine dropped insignificantly from 70% to 65%, between 1960 to 1980, but there were increased gradually between 1980 and 2019, after hitting a low of 65%. In the second graph , it is apparent that the doing hours of washing clothes, preparing meals, cleaning per week, per household shrink shrank consistently between 1920 and 2019. Per week, number of hours per week dropped sharply in first 40years, and went down slightly after 1960, until 2019.
|


 인쇄
인쇄


 비밀번호 확인
 댓글 0개
댓글 0개


 불편사항 신고