


 인쇄
인쇄


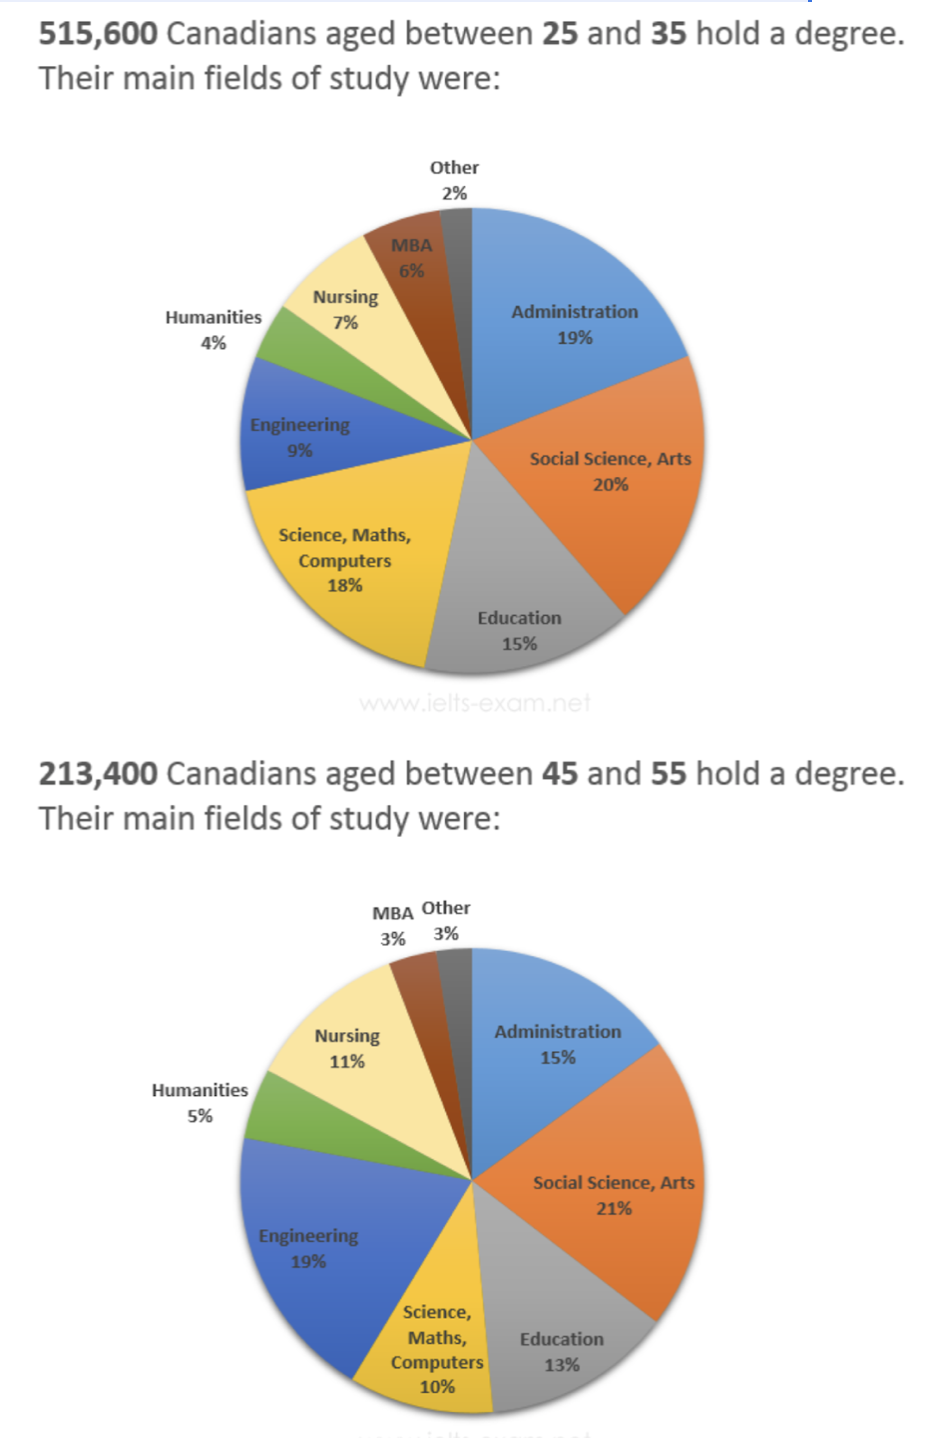
The graphs below show the post-school qualifications held by Canadians in the age groups 25 to 35 and 45 to 55. Summarise the information by selecting and reporting the main features, and make comparisons
The charts
describe the post-school qualifications among the Canadians who were aged 25-35 and 45-55.
Overall, the younger age group of people between 25 an 35 showed that their most popular
field is social science and arts as a (a는 앞으로 다른 글들에서도 싹 다 빼주시면 됩니다. as a percentage of 20 이렇게 쓰면 가능은 하겠으나, 말 그대로 가능만 하고 일반적으로 이렇게 쓰지도 않아요.) 20% and the least one is humanities with
only a 4% while old group had studied social science and arts the most with a
21% and MBA was the lowest field with a 3%. (+Overview에서는 구체적인 수치가 들어가지 않습니다.)
As clearly
seen from the chart, there is a significant difference between old age group
and young group in that the most popular fields for young group were social
science and arts, administration and science, maths, computers as a percentage
of a 20%, 19% and 18% respectively. However, engineering was the second most
study field for old group with a 19% while only a 9% of young group studied
that major. Other study fields such as education, humanities had were similar
aspects among two different age groups with the percentage a 15%, 4% for young
people and a 13%, 5% for older group respectively. Lastly, the
number of nursing students in (이렇게 쓰면 잘못된 분석이 됩니다. 비율 자체는 older 쪽이 더 많죠. 그러나 절대적인 수치를 따져보면 younger 쪽이 더 많습니다. 즉, number 가 더 많다고 해서는 안 돼요.) the older group are is slightly greater than young group
as a figure of a 11% and a 7% respectively. (세부적인 분석과 관련해서 제일 뿌리가 되는 사항이 빠져있는데, 이에 대해서는 총평에서 말씀드리겠습니다.)
총평: (5/6/6/6) 6.0
오랜만에 task1을 쓰셔서 그런지 조금 아쉽네요.
지금 분석의 가장 기초가 되는 사항은 바로 각 나이대 사람들의 절대적인 수입니다. 25세~35세 그룹에서는 51만명 가량의 사람이 있고, 45세~55세 그룹에서는 반도 안 되는 21만명 가량의 사람이 있죠. 이걸 시작부터 박고 들어가야 하며, 또한 이러한 정보를 근거로 봤을 때 초록색은 틀린 분석이 되므로 주의해주세요!
수고하셨습니다 :)
where relevant.

 비밀번호 확인
 댓글 0개
댓글 0개


 불편사항 신고