


 인쇄
인쇄


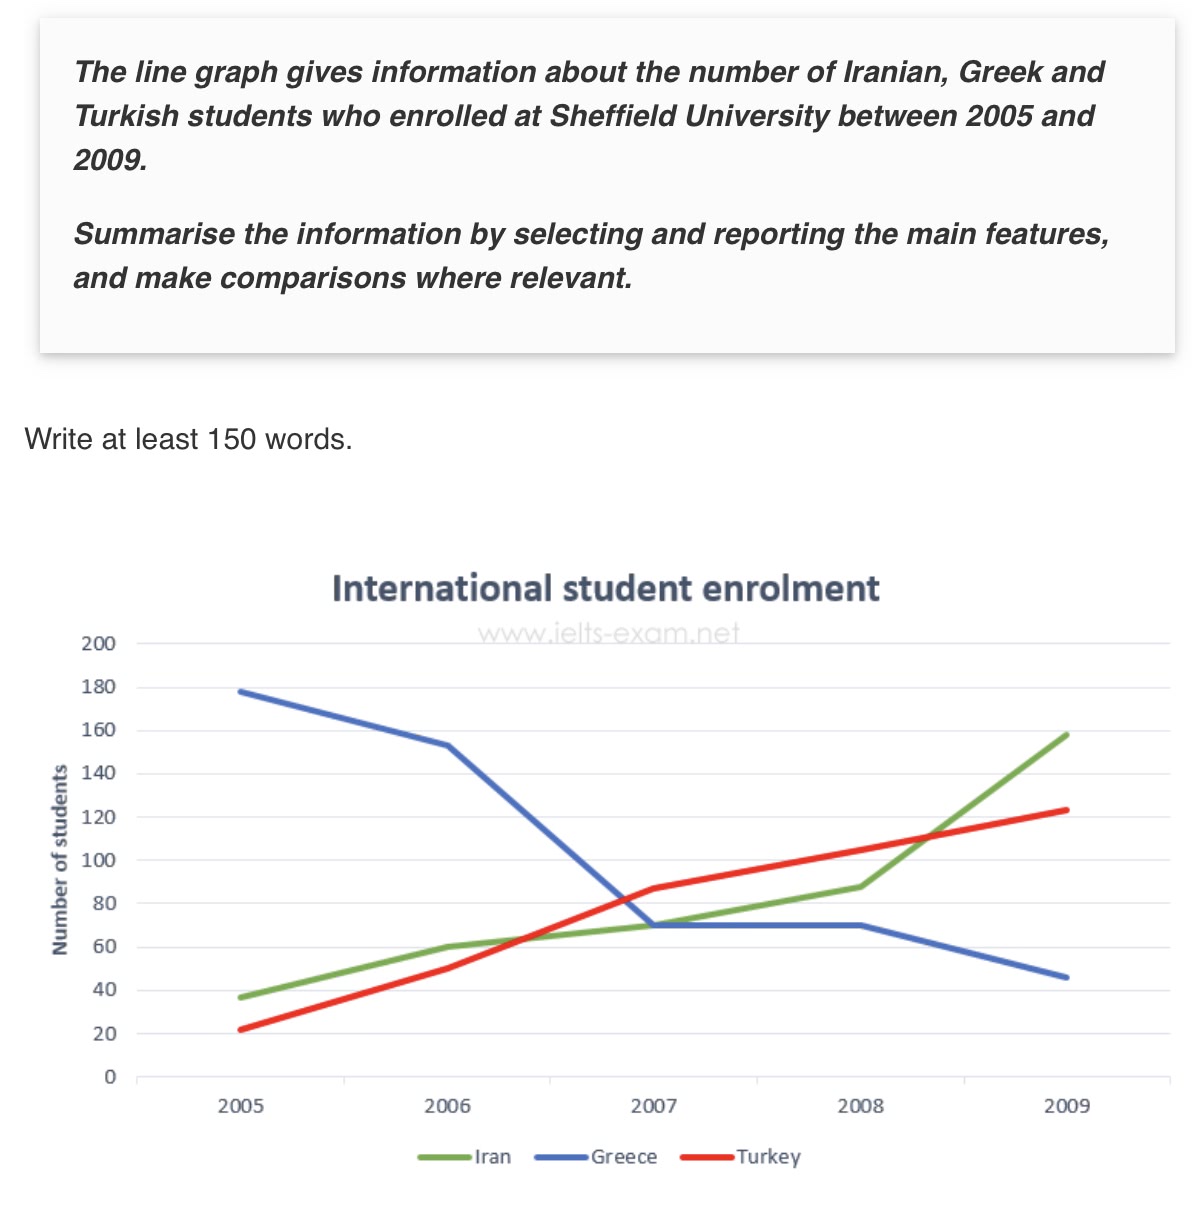
The given chart shows how many students from Iran, Greece and Turkey enrolled to at Sheffield University from 2005 to 2009. Overall, enrollment of both Turkish and Iranian students were significantly increased, while that of Greece students showed a downward trend during this period.
Firstly, in 2005, Greek was the country with the highest number of admissions at 180 students, while Iranian and Turkish numbers were around 40 and 20, respectively. However, from this point to 2007, enrollment of Greek students went dramatically down to approximately 70, and at the moment, there were noticeable differences among the three nations; Turkish students enrolled the most with about 90 in 2007. Plus, the number of Greek enrollment showed level off between 2007 and 2008, and gradually decreased by almost 40 again.
Secondly (여기는 secondly로 이을 사항이 아니긴 한데, 이에 대해서는 총평에서 조금 더 말씀드리겠습니다.), the graph also shows that Turkish and Iranian students’ enrollment continuously rose over the five years. During the middle The middle of 2006, the number of Turkish students overcame that of Iranian students, and remained as the highest figure from 2007 to 2008.
Finally, since the middle of 2008, the amount of students from Iran rocketed sharply and eventually surpassed that of Turkish students.
총평: (7/5/7/7) 6.5
다른 부분은 다 좋아서 6.5는 무조건 확보되고, 채점관에 따라 7.0까지도 괜찮을 거지만, 여하튼 문단 구분에는 약간의 아쉬움이 남는 상황입니다. 기본적으로 문단을 나눌 때에는 누가 봐도 명백한 기준이 존재해야 하는데, 이 글은 그렇지 못한 상황입니다. 처음에는 연도별로 나눴나 싶기도 했지만, 두/세 번째 문단에 2007-8이 중복되었기 때문에 연도는 기준이 되지 않고, 그렇다고 해서 국가별로 나뉜 것도 아니기 때문에 이도저도 아닌 상황이 됐죠.
이러한 점에 있어서는 조금 보완이 필요합니다.
수고하셨습니다 :)

 비밀번호 확인
 댓글 0개
댓글 0개


 불편사항 신고