


 인쇄
인쇄


문제]
<TASK 1.>
The graph below shows the number of tourists visiting a particular Caribbean island between 2010 and 2017.
(cam15. T2)
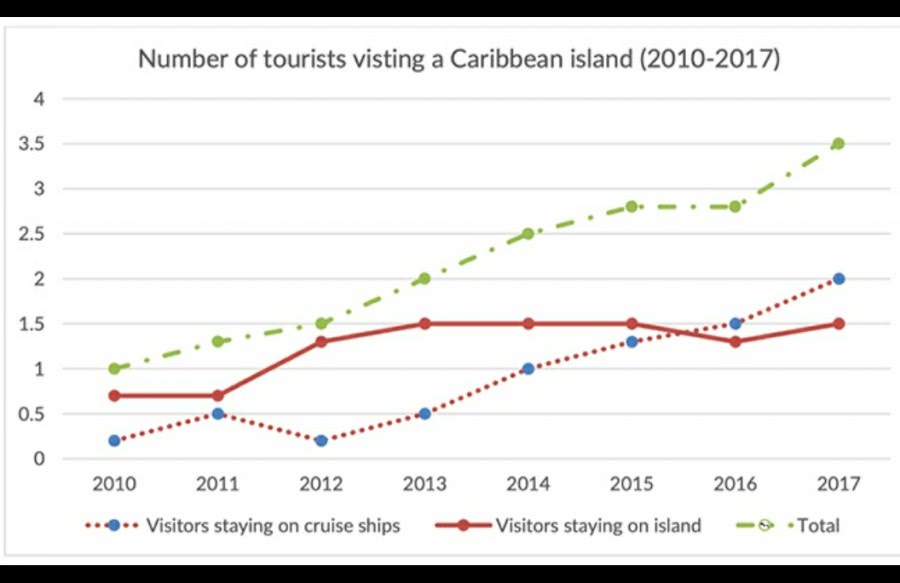
The line graph illustrates how many people visited a particular Caribbean island from 2010 to 2017.
Overall, it is noticeable that the total number of visitors increased for seven years from one million people to 3.5 million people. (Overview를 넣을 때에는 구체적인 수치는 따로 적시하지 않습니다.)
Looking at the graph more closely, it can be seen that the number of visitors staying on the island was higher than those who stayed on cruise ships by 2015. In 2010, the visitors staying on the island were more than three times of those that on cruise ships, at approximately 0.25 million and 0.7 million, respectively. However, the gab was reduced until 2011 because the visitors staying on the island were not changed at approximately 0.7 million people, while the number of visitors staying on cruise ships went up from 0.2 million to 0.5 million people. From 2011 to 2013, there was a skyrocket in skyrocketed the visitors staying on the island, representing at 1.5 million people, followed by stable for two years. In the middle of 2015, the figure of tourists staying on cruise ships overtook that on the island. Therefore, in 2016, the number of tourists staying on cruise ships started to be bigger than the figure of people staying on the island and this trend continued until 2017.
작성시간 17분
words 204
총평: (6/6/7/6) 6.5
빨간 부분이 그렇게 많지는 않을 것을 통해 보실 수 있듯이, 적어도 '틀린' 건 별로 없었습니다. 대신 구조의 수정은 필요한 상황이고요. 위에서 말씀드렸듯이 Overview에서는 구체적인 수치가 들어가지는 않습니다. 저 부분을 대신해서 해당 문단에 섬/배의 Overview를 넣어주시면 돼요. 반대로, 그 밑 문단에서는 현재 있는 내용을 조금 간추리고, 이를 대신해서 '전체 방문객' 에 대한 추가적인 분석을 넣어주시면 됩니다. 이 자리에 구체적인 수치가 들어간다고 보시면 돼요.
수고하셨습니다 :)

 비밀번호 확인
 댓글 0개
댓글 0개


 불편사항 신고