


 인쇄
인쇄


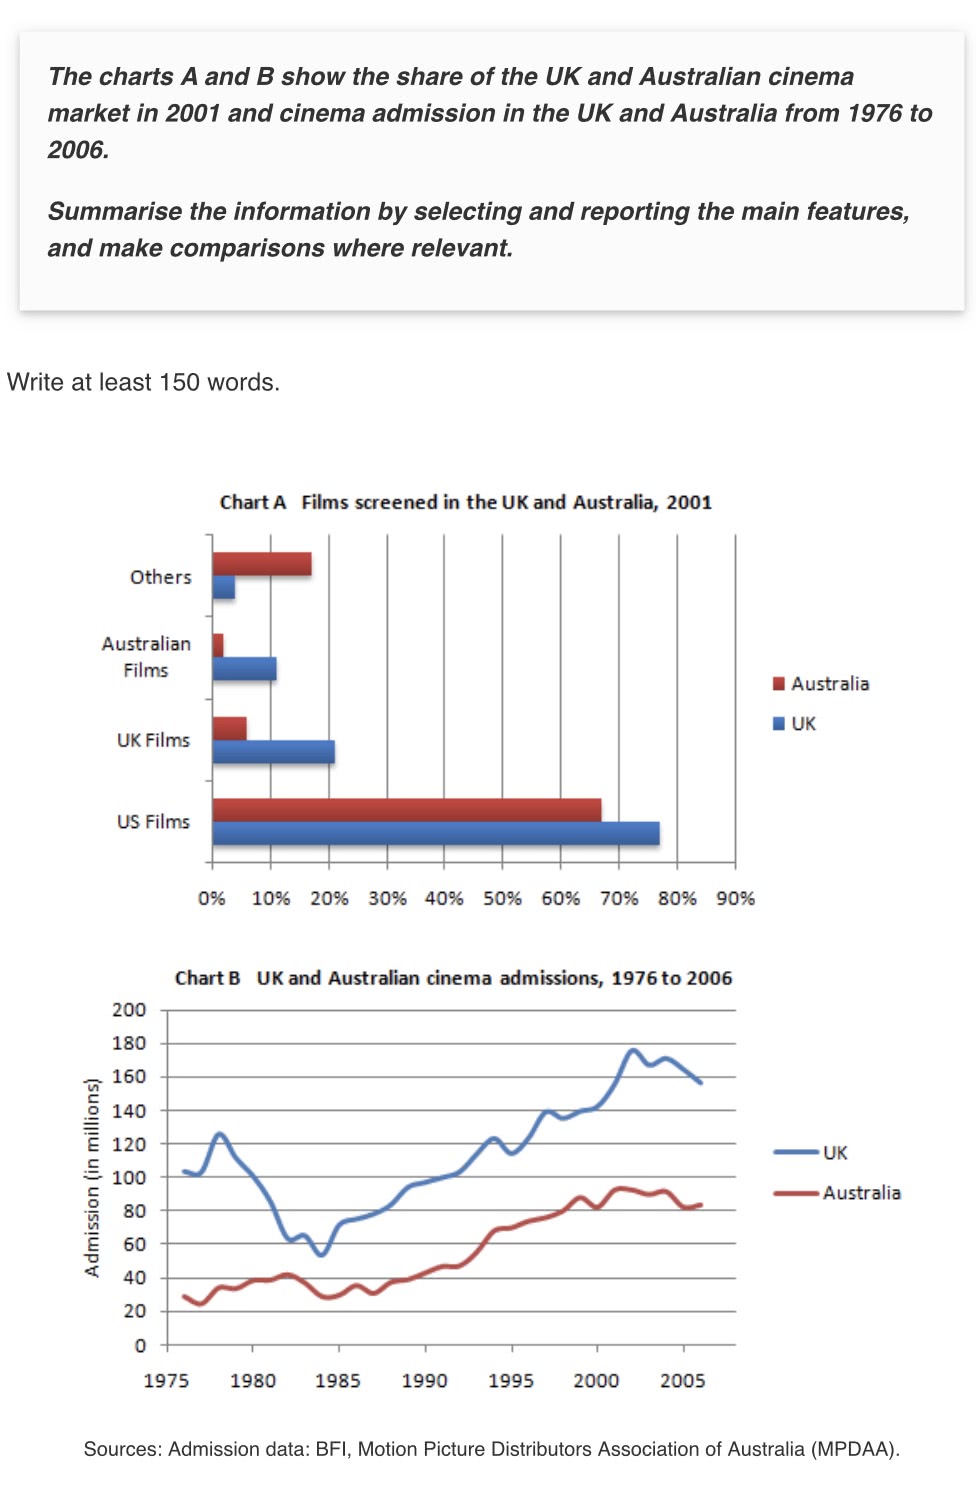
The given bar graph illustrates the share of
the UK and Australian cinema market in 2001 and the line graph gives
information about the cinema admission in the UK and Australia between 1976 and
2006.
Overall, it is evident that the US films were (기존 표현도 아예 틀린 건 아닌데, 일반적으로는 이렇게 씁니다. 그냥 참고로만 보세요~) was
most popular in the United Kingdom, as well as Australia. Furthermore, and Australians who bought the cinema admission
increased from 1976 to 2006, but the figure was always lower than that of the UK.
Looking at the graph more closely, one can
see that the US film was the highest in both countries, at more than 65
percent, in both countries. Also, the UK films are more popular than Australian
ones in the UK. In contrast, other films were higher than Australian and the UK films
in Australia, this figure was almost four times, at around 17 percent in 2001.
As for the cinema admission, the UK figure significantly fluctuated, starting
from more than 100 million in 1975 to less than 160 million in 2005. While, in In
1985, this peaked at the lowest point at approximately 46 million. In Australia,
the figure also fluctuated, but gradually grew grow to around 80 million in 2005.
21분 걸렸어요!
총평: (6/6/6/6) 6.0
지금처럼 표가 두 개 있는 경우, Overview에서도 그냥 문장을 끊어서 작성해주시는 게 여러모로 안전합니다. 세부 분석을 하는 경우에도 그냥 문단 나눠주시는 것도 좋고요. 후자는 할로할로님 선택에 맡기겠지만, 전자는 꼭 끊어가세요! 어차피 문장이 길어지면 좋을 거 없습니다.
수고하셨습니다 :)

 비밀번호 확인
 댓글 0개
댓글 0개


 불편사항 신고