


 인쇄
인쇄


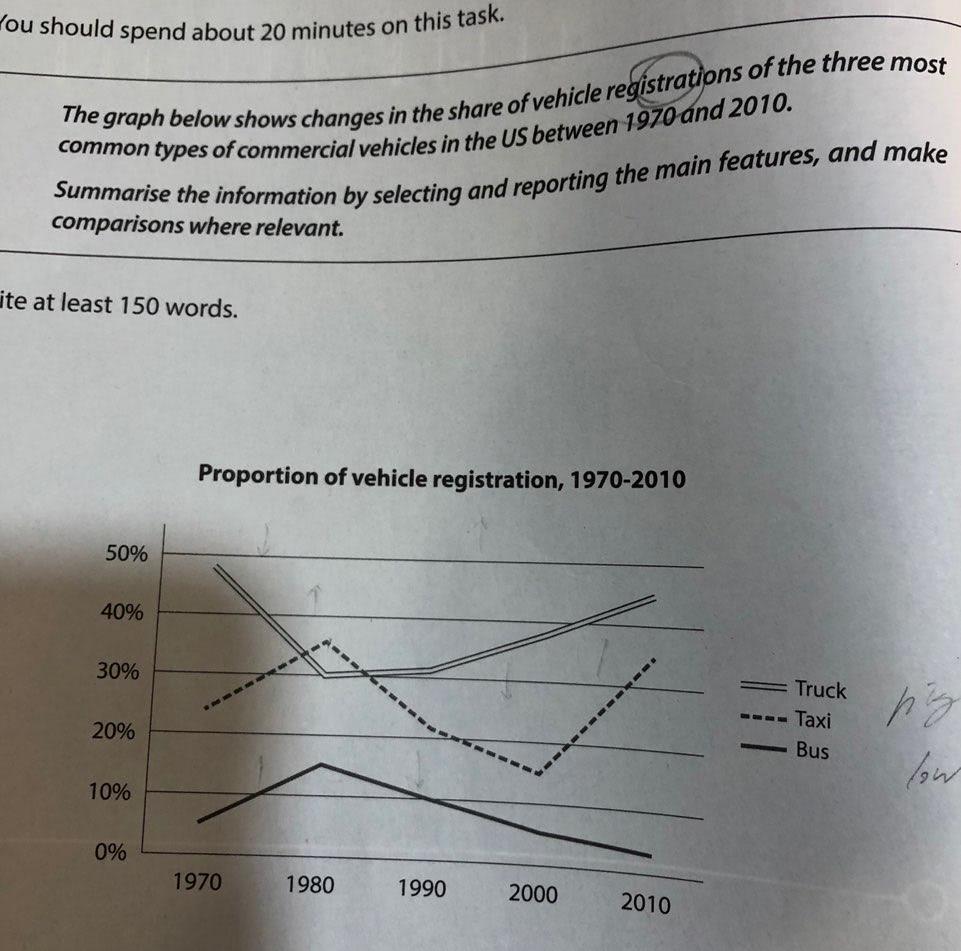
The line graph shows the figures of the three most common types of vehicles that in the US from 1970 to 2010
Overall, it is clear that the rates of taxi have experienced an up and down trend over the period. The percentage of bus grew in the first 10 years, but after then, it dropped until 2010. In contrast, the proportion of truck decreased initially, but, since 1980, it had rosed steadily.
Looking at the graph more closely, one can observe that the rates of taxi increased from about 23 percent in 1970 to 35 percent by1980, but, between 1980 and 2000, it dropped approximately 20 percent (여기의 경우도 이전의 퍼센트포인트를 활용해주셔야 합니다. 이 외에도 뺄셈을 한 모든 부분에 똑같이 적용되고요.), hitting a low of 15 percent. However, since then, it surged to 35 percent in 2010. In the case of bus, it increased by about 10 percent over a decade period, so it reached at 15 percent, but, after that period, it declined until 2010, with the reaching 3 percent. In contrast, the percentage of truck decreased first 10 year, with 30 percent in 1980, but it rosed continually between 1980 and 2010, reaching at 44 percent (참고로, 지금처럼 수치가 정확히 떨어지지 않을 경우에는 임의로 정하는 것이 아니라 대략~등의 표현을 사용해주셔야 합니다.) in 2010.
총평: (6/6/5/5) 5.5
이전 글의 퍼센트포인트+수치 간 역전이 이번 글에서도 마찬가지로 문제가 되었으며, 또한 추가적으로 비슷한 표현들과 문장 구조의 반복이 잦기 때문에 여기에 대해서도 해결이 필요합니다. 모범답안을 보셔서 해당 답안이 같은 내용을 어떻게 다르게 표현하는지를 꼭 익혀주세요~
수고하셨습니다 :)

 비밀번호 확인
 댓글 0개
댓글 0개


 불편사항 신고