


 인쇄
인쇄


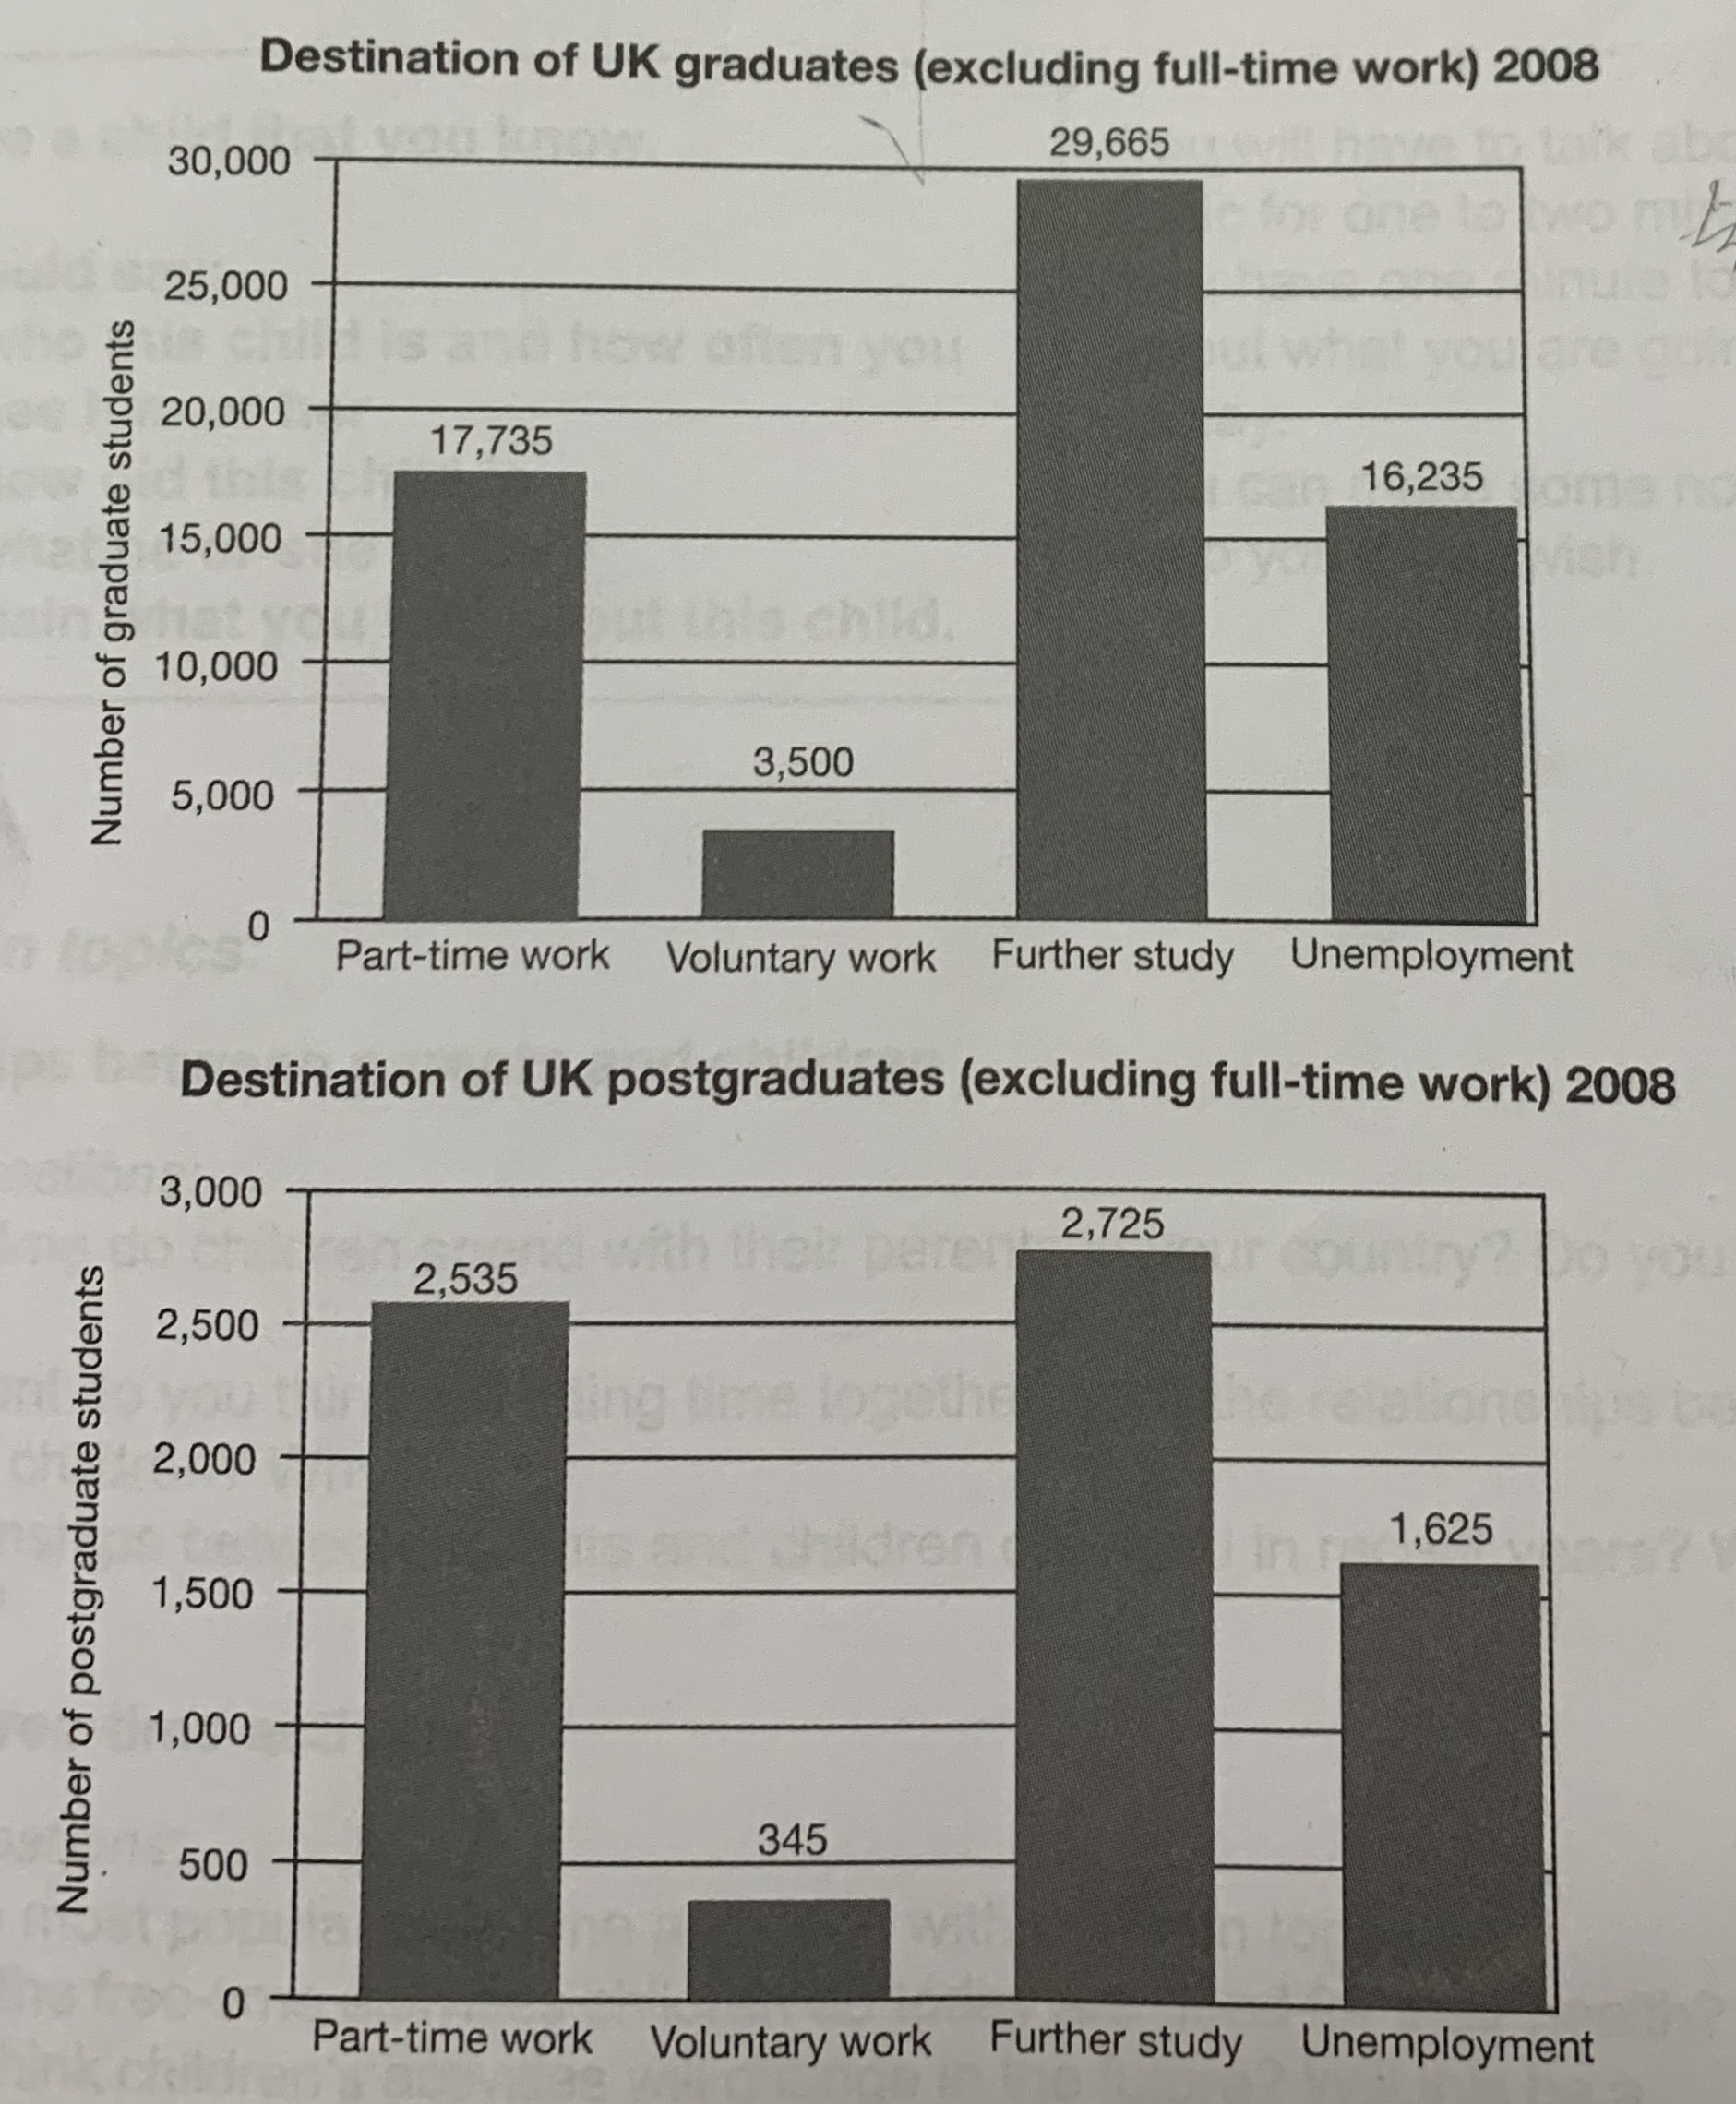
The given bar graphs give information about the different status of the British graduate and postgraduate after leaving college excluding full time employees in 2008;categorized Further study,Part-time work, Unemployment,and Voluntary work.
It is clear that the number of bachelor’s students is much more than that of master’s students.However, two charts show somewhat different results between two groups.
First of all, in both groups, the most number of the students pursued further studies, respectively 29,665 and 2,765. The second most popular decision to do after graduation was part time work,followed by unemployment which was the third common choice in both groups. Interestingly, there is less difference in figures between part-time work and unemployment in the first chart than the second chart. In other words, a similar number of graduate students made a choice to do part-time work and unemployment after finishing university. At the end, both student groups didn’t fairly choose voluntary work as doing after graduation. The numbers are 3500 and 345,respectively.

 댓글 0개
댓글 0개


 불편사항 신고