


 인쇄
인쇄


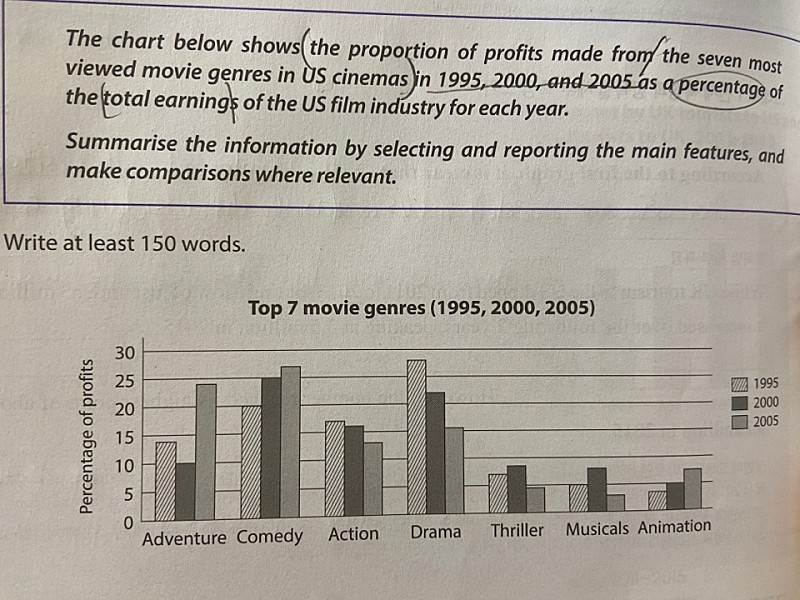
The bar graph illustrates the proportion ofprofits of the seven most viewed movie genres in US in 1995, 2000, 2005. Overall,it is clear that in two genres which is comedy and drama possessed highpercentage in all three years. Also, they all reached over 5% except for thriller,musical, and animation but never reached 30%. Moreover, this chart shows thatpeople don’t prefer to watch thriller, musicals, and animation in every year.
Looking at the graph more closely, one cansee that the percentage of drama reached highest level of between 25% to 30% in1995 and was lowest in animation. In 2000, all seven genres were over 5% andwhat’s more is that the percentage of drama was doubled of the percentage ofadventure. However, in 2005, most of genres were under 20% except adventure.The gap between 1995, 2000, and 2005 was most narrowed in action and theirpercentages were around 15%.

 댓글 0개
댓글 0개


 불편사항 신고