


 인쇄
인쇄


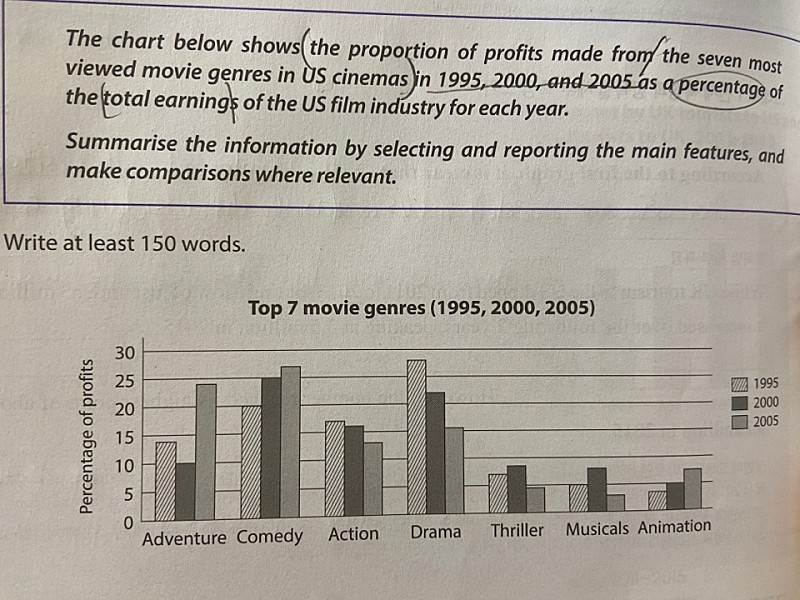
The bar graph illustrates the proportion of profits of the seven most viewed movie genres in US in 1995, 2000, 2005. Overall, it is clear that in two genres which is comedy and drama possessed high percentages in all three years. Also, they all reached over 5% except for thriller, musical, and animation but never reached 30%. Moreover, this chart shows that people don’t did not (줄임말은 풀어써주셔야 합니다.) prefer to watch thriller, musicals, and animation in every year.
Looking at the graph more closely, one can see that the percentage of drama reached highest level of between 25% to 30% in 1995, while animation showed the lowest rate and was lowest in animation. In 2000, the share of all seven genres were over 5% and what’s more is that the percentage of drama was doubled of the percentage of adventure (1. 줄임말은 풀어써주시고, 2. 새로운 내용이 있으면 웬만하면 새로운 문장으로 넣어주시는 게 좋습니다.). However, in 2005, most of genres were had a rate of under 20% except adventure.The gap between 1995, 2000, and 2005 was most narrowed in action and their percentages were more or less around 15%.
총평: (6/6/6/6) 6.0
이번 글도 이전과 마찬가지로 중앙정렬과 띄어쓰기가 문제가 되는 상황인데, 일단 저는 이게 문제가 되지 않았다고 가정하고 점수를 매겼습니다. 실전에서는 이렇게 자비롭지 않으니까 반드시 단어를 잘 띄어주시고, 글도 좌측으로 정렬해주세요!
수고하셨습니다 :)

 비밀번호 확인
 댓글 0개
댓글 0개


 불편사항 신고